The Southeast Blueprint Explorer - Now with more to explore!

In my blog last month, I highlighted the new features of the Southeast Conservation Blueprint Explorer viewer that were already available, and previewed a few more that were coming soon. The Explorer is a simple online viewer that’s intended to make the Blueprint easy for anyone to access without high-tech software or GIS expertise. One of those new functions is now available: pixel mode! One of the most frequent questions we here from users is, “why is this place right here purple?” Pixel mode can help answer that question.
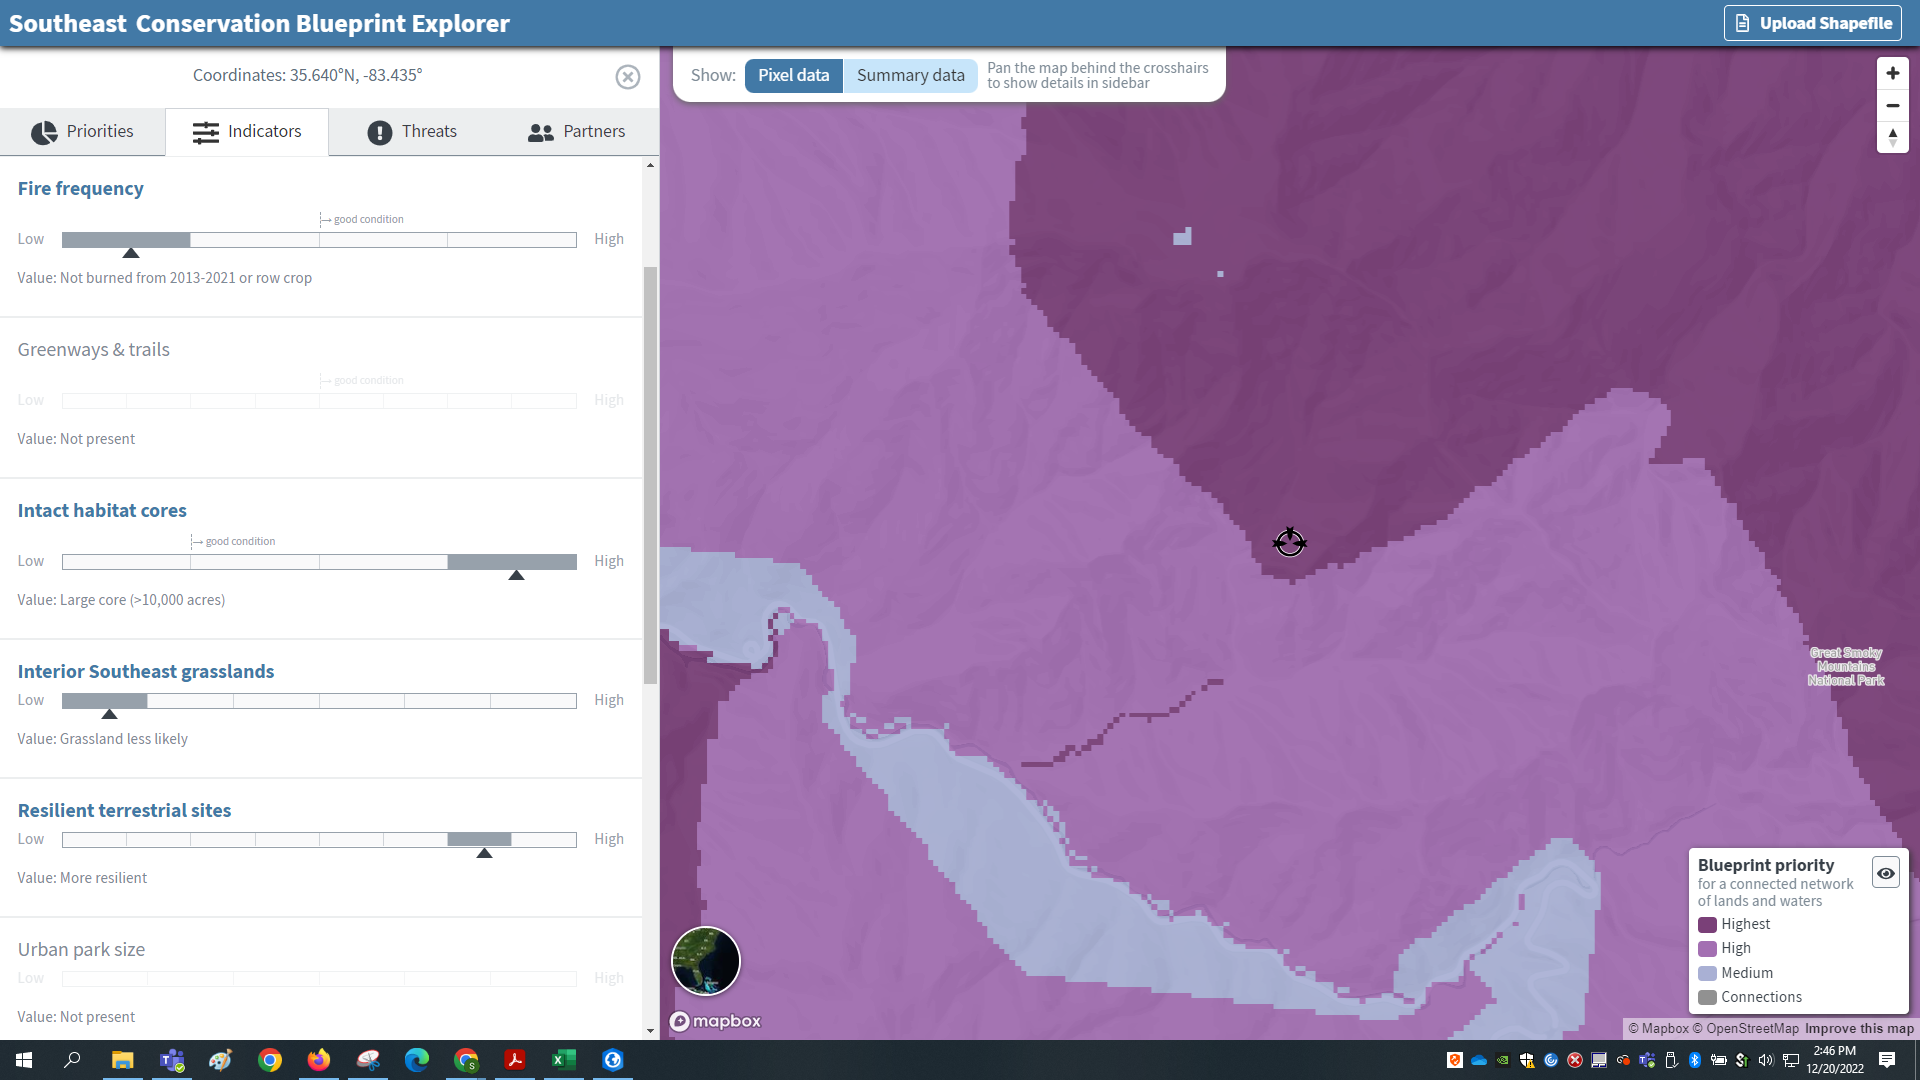
Pixel mode allows you to discover what’s driving the Blueprint priorities within the smallest unit of the analysis: a 30 m x 30 m pixel. All the Blueprint datasets are rasters, a spatial data format that represents the landscape as a grid of tiny, equally sized squares. Each of those squares is a pixel. The smaller the pixel, the finer the resolution of the data. A 30 m x 30 m pixel like those used in the Blueprint data is a bit less than 0.25 acres in size.
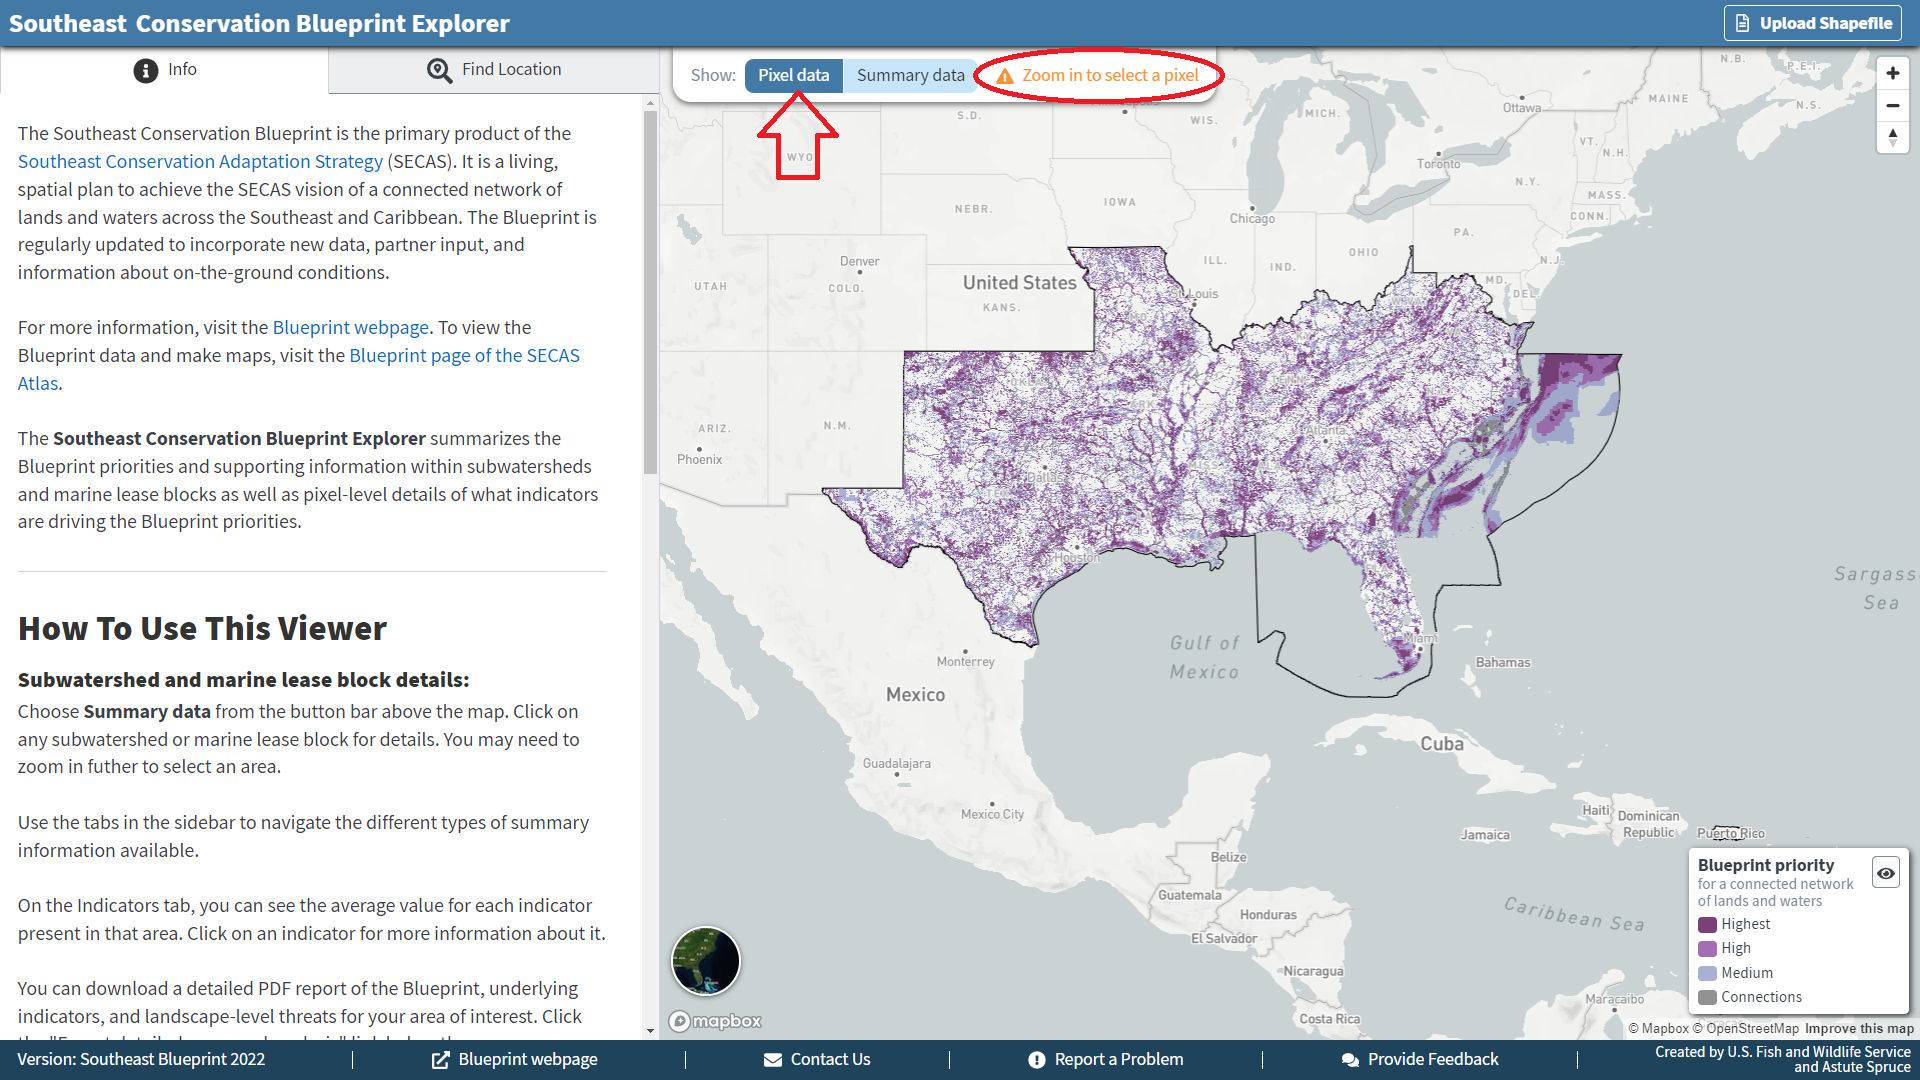
When you first visit the Blueprint Explorer, you’ll still start in the familiar “summary data” mode by default, which allows you to select a 12-digit HUC subwatershed in the inland environment or outer continental shelf lease block in the marine environment and view summarized Blueprint information for that area. Now, there’s a new toggle at the top that allows you to switch to “pixel data”.

When you click on “pixel data” and zoom far enough into the map, a bulls-eye will appear in the middle. The left-hand sidebar will tell you about the Blueprint priorities, hubs and corridors, indicators, threats, and more that occur in the pixel in the center of that bulls-eye. You can then use your cursor (the hand) to pan the map behind the bulls-eye and identify different pixels. This allows you to see exactly why a specific area has been prioritized in the Blueprint.
Even for staff members who are already very familiar with the Blueprint, pixel mode can be super helpful. In the past, we had to pull up the individual layers for each dataset to see how a particular pixel scored in the Blueprint, indicators, and connectivity analysis. Now we can more quickly explore the Blueprint priorities in this easy-to-use online viewer!