How the Southeast Conservation Blueprint addresses climate change
While the Southeast Conservation Blueprint is designed to be a climate adaptation strategy, all the ways it does that aren’t always obvious. Here are three major ways the Blueprint addresses climate change:
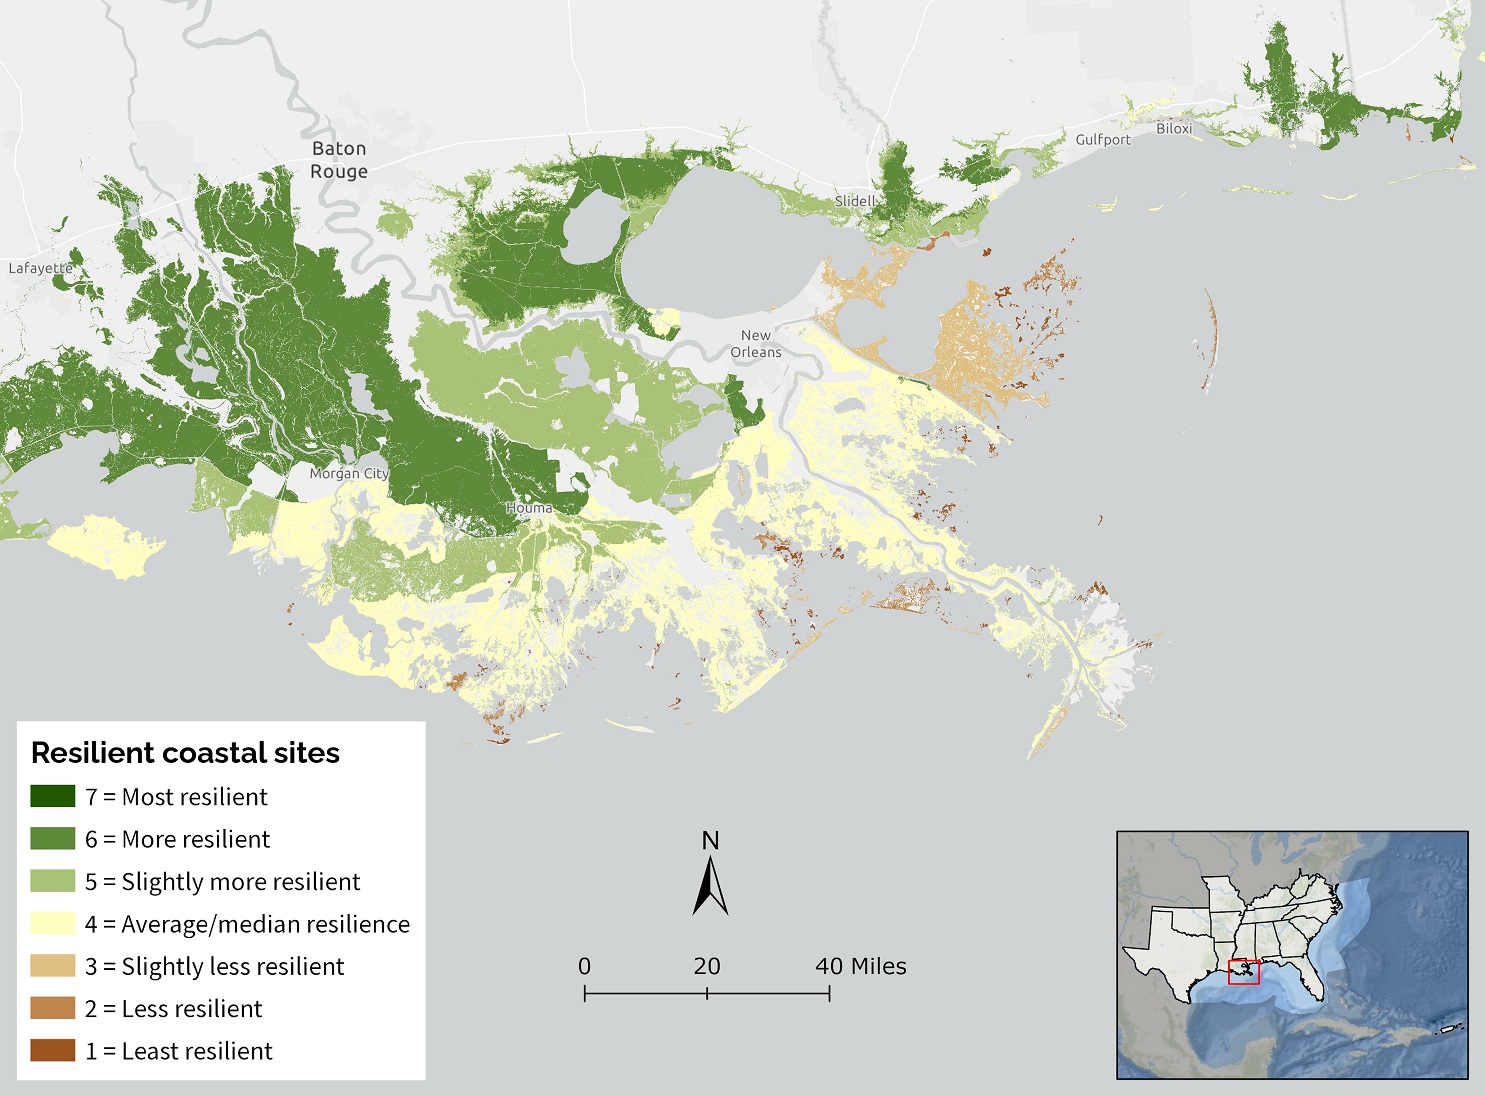
1) Resilient sites and conditions
Almost all of the Blueprint indicators are designed to prioritize places and conditions that will still be important as the climate changes. Species and ecosystems may shift, but basic things they’ll need, like intact habitat cores and natural landcover in floodplains, will still be important. For some indicators, the climate change connection is explicit. For example, the descriptions and methods for resilient terrestrial sites and resilient coastal sites are very targeted to climate change. For others, the connections with climate resilience might be less obvious, like with intact habitat cores, permeable surface, and natural landcover in floodplains. These are all conditions and features that will still be important as the climate changes. Even indicators that use multiple species, like East Gulf Coastal Plain open pine birds, use species to identify conditions that will still be important as the climate changes.
2) Connectivity
Connectivity is one of the most commonly used climate adaptation strategies. The Blueprint incorporates connectivity in multiple ways. The resilient coastal sites indicator looks at places that’ll be important for salt marsh and mangroves to migrate inland. The network complexity indicator looks at the number of connected stream classes so aquatic species can move into new conditions as needed. Indicators like intact habitat cores and resilient terrestrial sites look at how locally connected habitat is. The Blueprint also includes a connectivity analysis to add even more connectivity in terrestrial, freshwater, and marine ecosystems. These corridors connect marine, coastal and inland areas and span different climate gradients.

3) Regular updates
Climate change continues to alter the landscape. We also learn new things every day about what that might mean for the future. Through the regular Blueprint update cycle, the Blueprint can respond to those changes and incorporate new information as well as we learn more about how to best respond.
Future improvements
All that said, there’s always room for improvement in how the Blueprint addresses climate change. The biggest weak point right now is in the ocean. Marine ecosystems, and most of the marine indicators, are very sensitive to changes in the locations of currents and mesoscale eddies. That really hit home for me when watching the Okeanos Explorer in some deepwater area of the Atlantic in 2019. I was watching the sub move through huge areas of dead deep-sea corals with very little life where the currents and productive waters used to be. Then, just a few minutes later, the sub moved into the area where the current was now and it was so full of life you could barely see through the camera. The next generation of ocean models finally do a decent job predicting future current locations. That should help us better integrate future ocean changes into the indicators and identify when those productive places might be in the future.