Blueprint 2023 data now available in the Blueprint Explorer
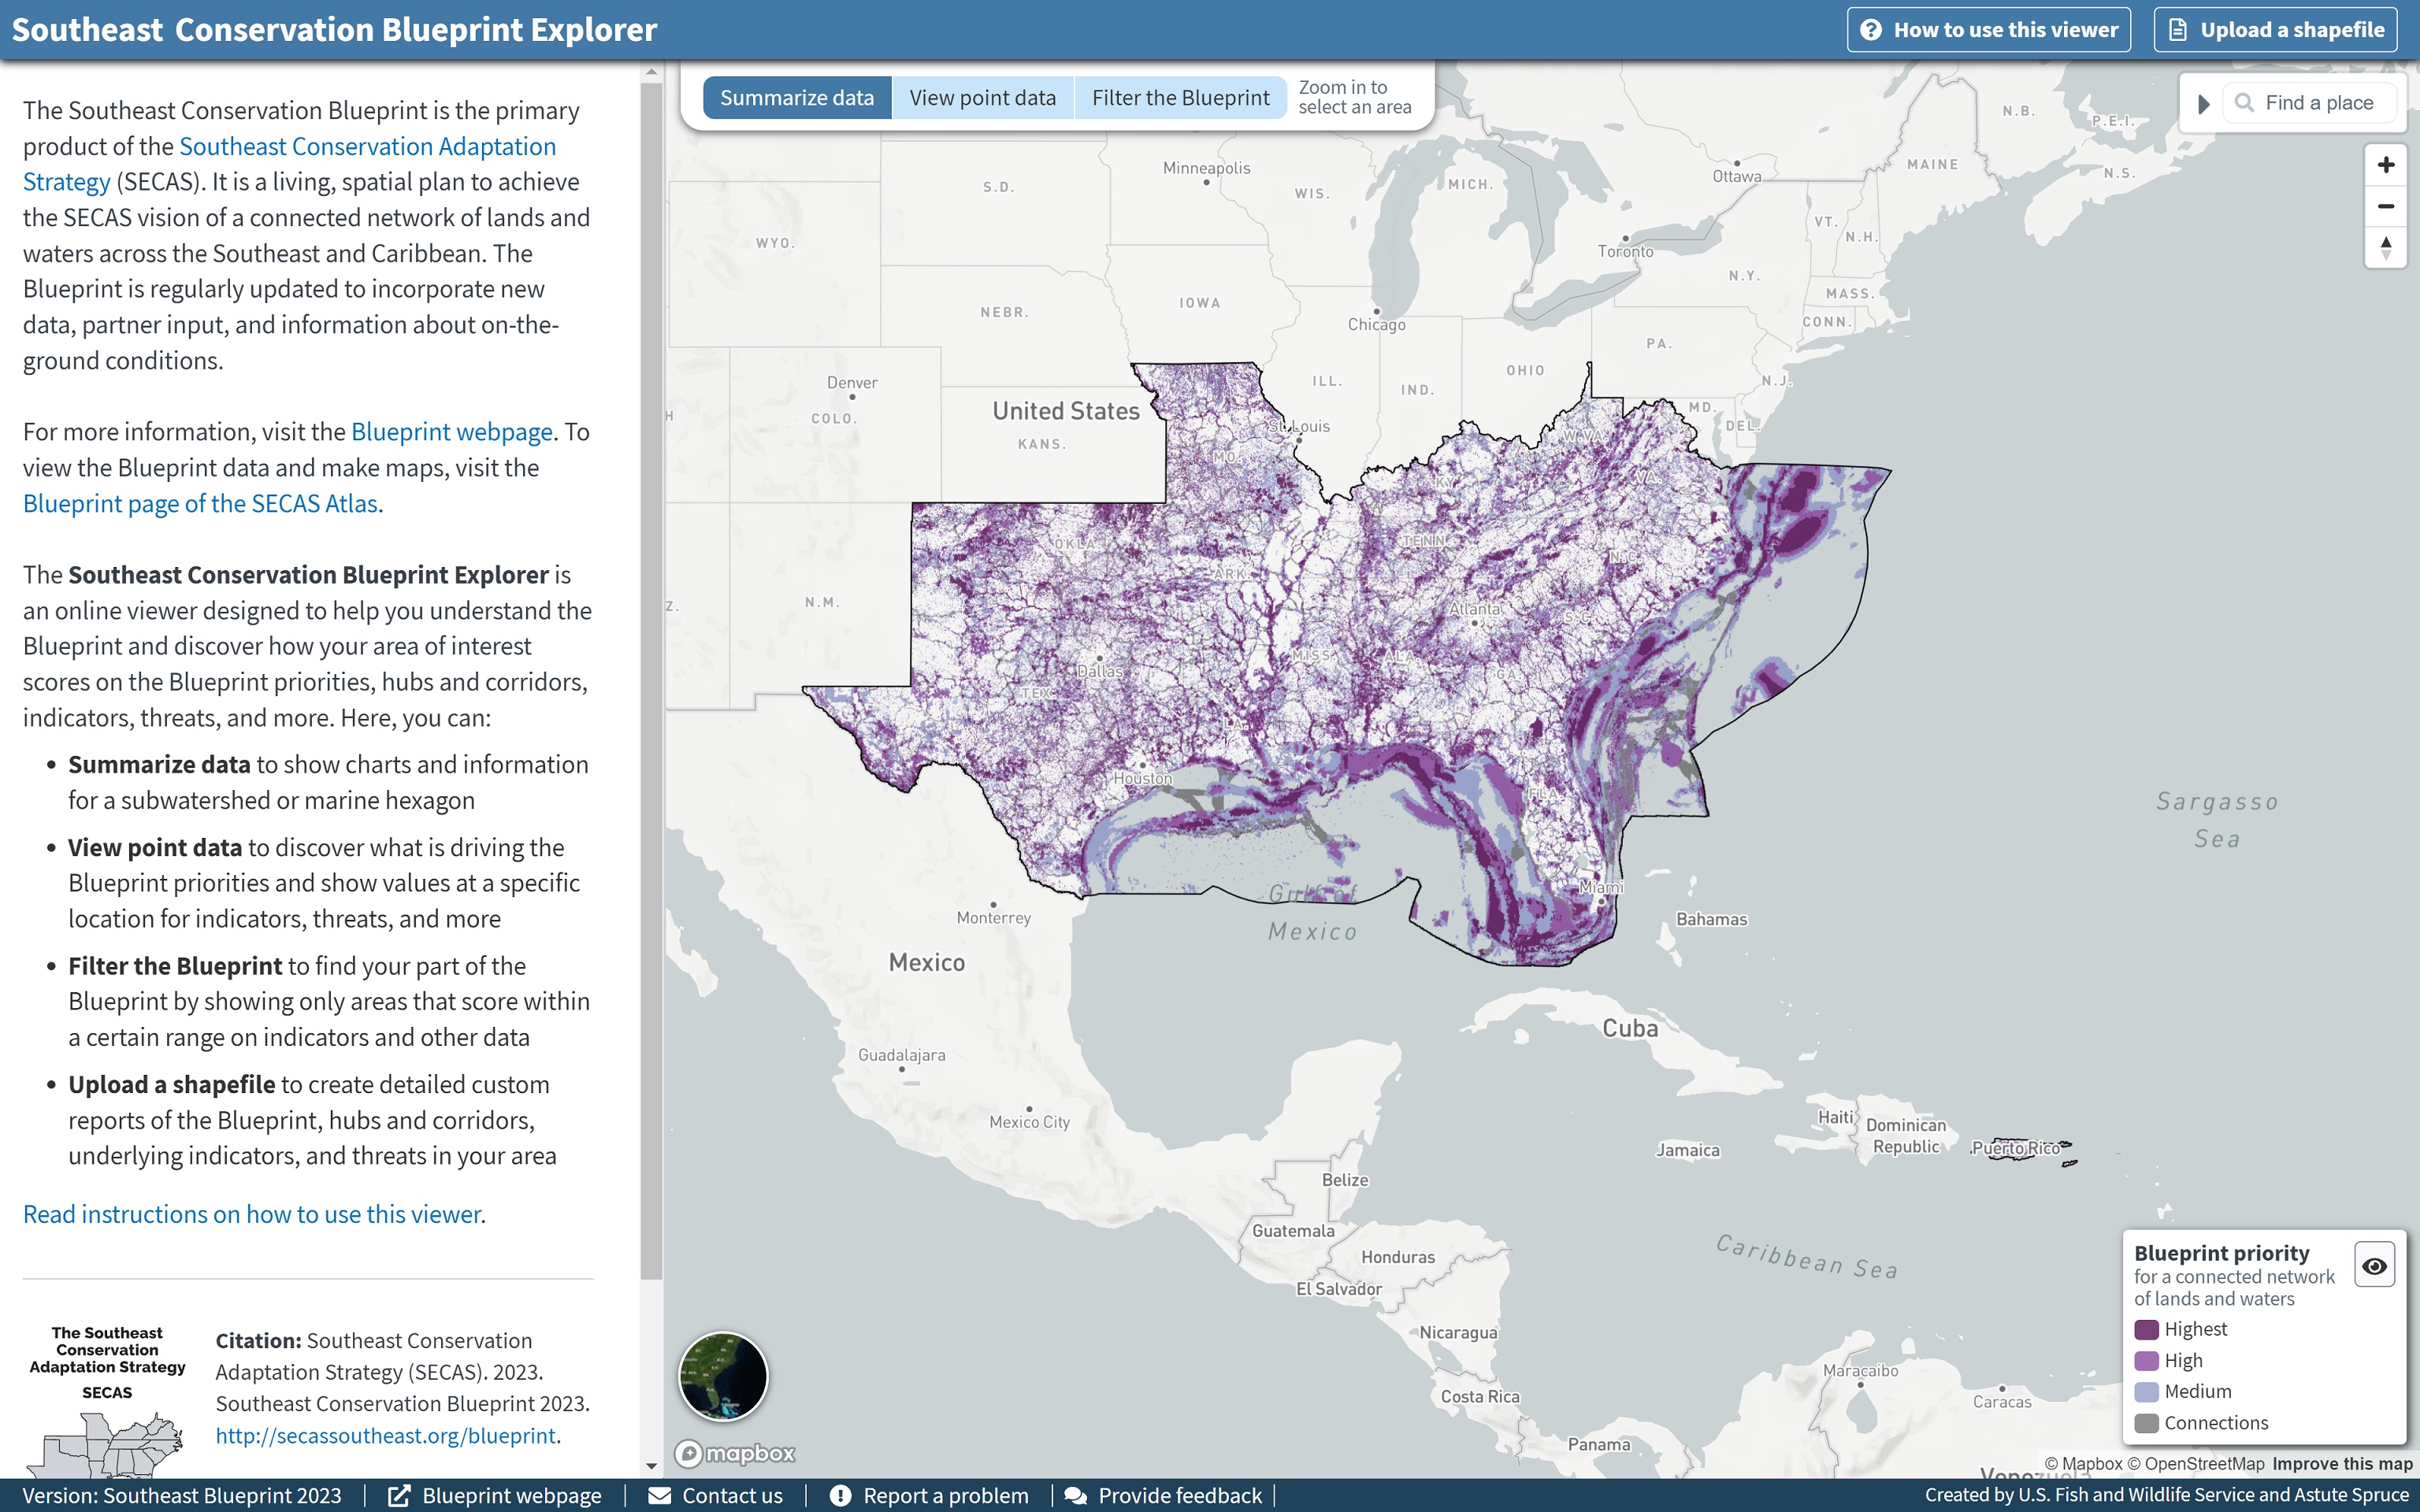
The latest update to the Southeast Conservation Blueprint, version 2023, is now available in the Blueprint Explorer viewer! This easy-to-use mapping platform is designed to help you understand how your area of interest scores in the Blueprint, and why. It offers several different modes that allow you to summarize by a watershed or marine hexagon, drill into the data underlying a single point, and filter the Blueprint to narrow it down to the part you want to focus on. If you upload a shapefile, the automated reporting function will also generate a custom report for your area of interest. Now that the Explorer has caught up to Blueprint 2023, you can use these great features to discover the Blueprint priorities in new areas, like Puerto Rico, the U.S. Virgin Islands, and the offshore Gulf marine environment.
The pre-run reports for each SECAS state/territory available on the Resources page have also been updated to Blueprint 2023. Reports for Puerto Rico and the U.S. Virgin Islands are now available there for the first time!
Updated data and summary units
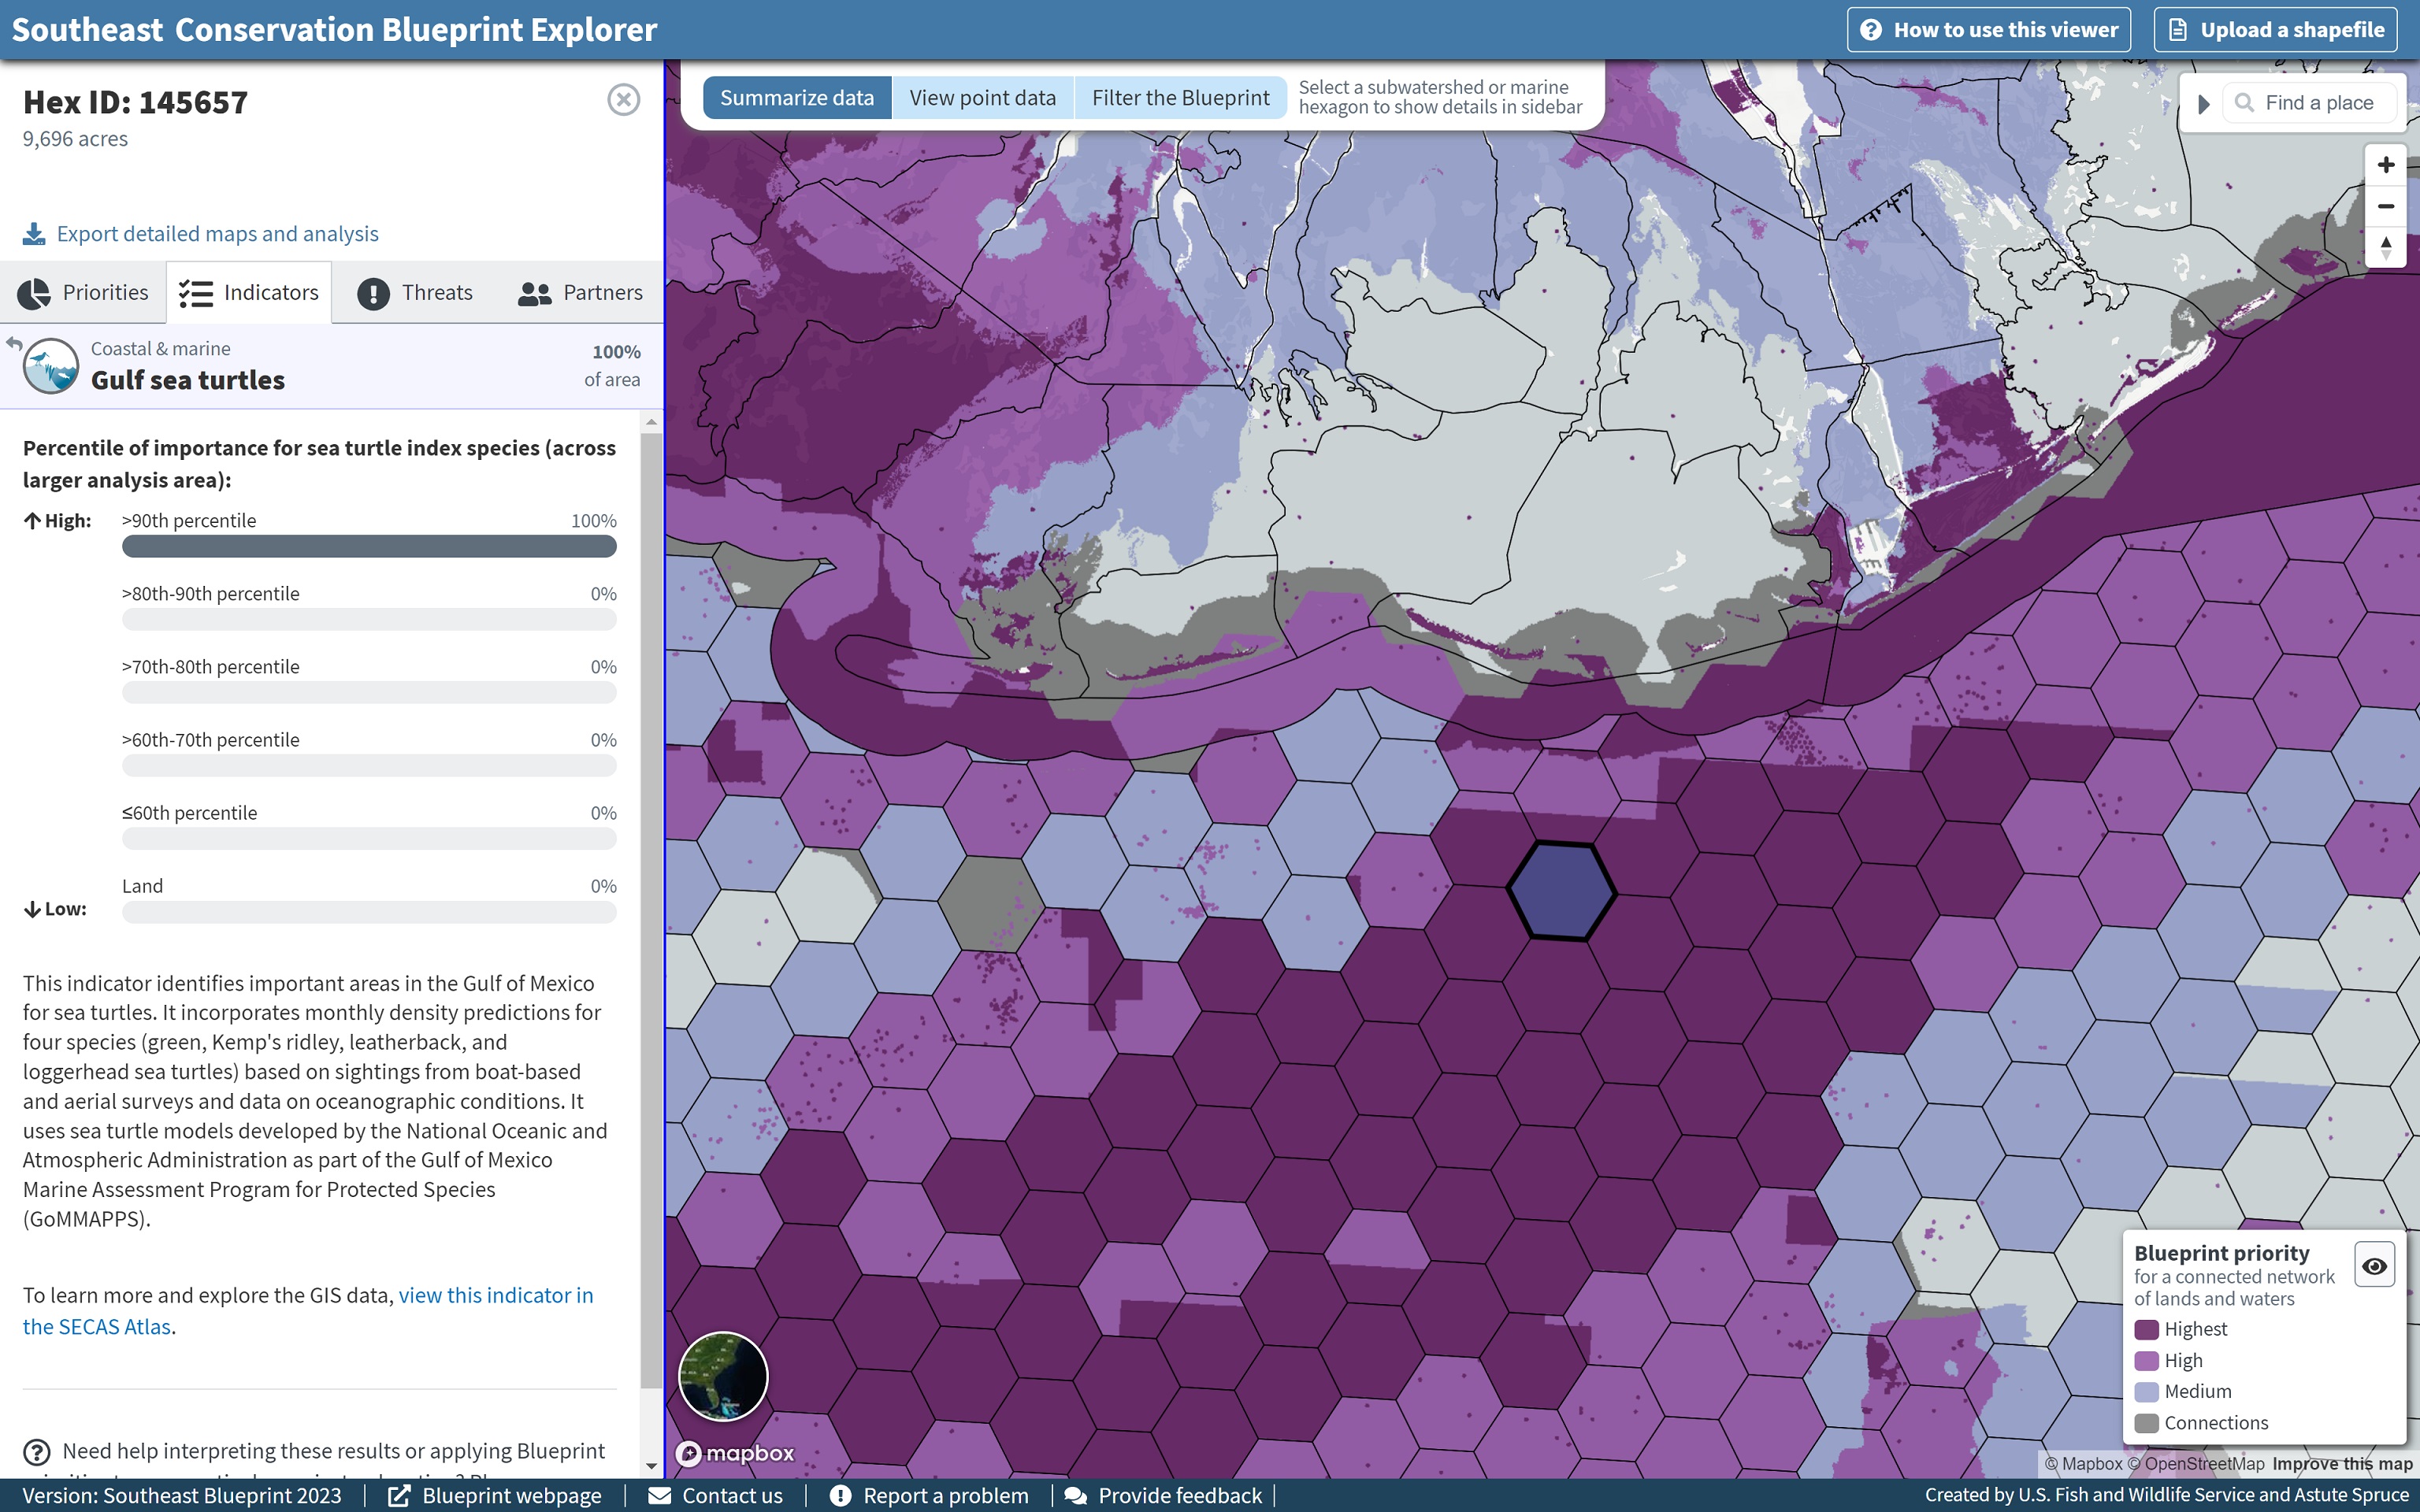
As part of this update, we changed the summary unit for marine areas from Outer Continental Shelf lease blocks to the 40 km2 hexagons used by EPA and the Gulf of Mexico Marine Assessment Program for Protected Species (GoMMAPPS). The previous lease blocks did not go far enough into the nearshore marine environment in the Gulf of Mexico to connect with the 12-digit HUCs used for inland areas, creating an unselectable “no-man’s land” just offshore. In addition, lease blocks were not available for the U.S. Caribbean marine environment. These hexagons are consistent with the scale of the GoMMAPPS data used for the Gulf marine mammals and Gulf sea turtles indicators, and therefore align with the Blueprint data in the Gulf marine environment.
Several other datasets have been updated as well since the last time I blogged about the Explorer back in February. Sea-level rise projections now feature the most recent NOAA sea-level rise inundation data from NOAA’s Sea Level Rise Viewer. The data on current urban areas now reflects the 2021 National Land Cover Database, updated from 2019. As a heads-up, unfortunately, you still won’t see urban growth data in the U.S. Caribbean. The FUTURES model projections for the contiguous United States developed by the NC State University Center for Geospatial Analytics don’t yet extend there, but the research team is already applying for funding and exploring approaches to expand their work to Puerto Rico and the U.S. Virgin Islands.
Interface improvements
In addition to new data, SECAS staff have also refined several features based on feedback from a recent round of user testing conducted by members of the user support team. We met with ten key users and partners across four organizations who graciously shared their time to help improve the Explorer interface. Staff gave them a series of tasks, asked them to narrate their thought process, and observed where the testers found things easy or difficult to do. By identifying “pain points” where folks tended to get stuck, as well as the workflows that made intuitive sense, we identified several opportunities to improve the Explorer functionality.
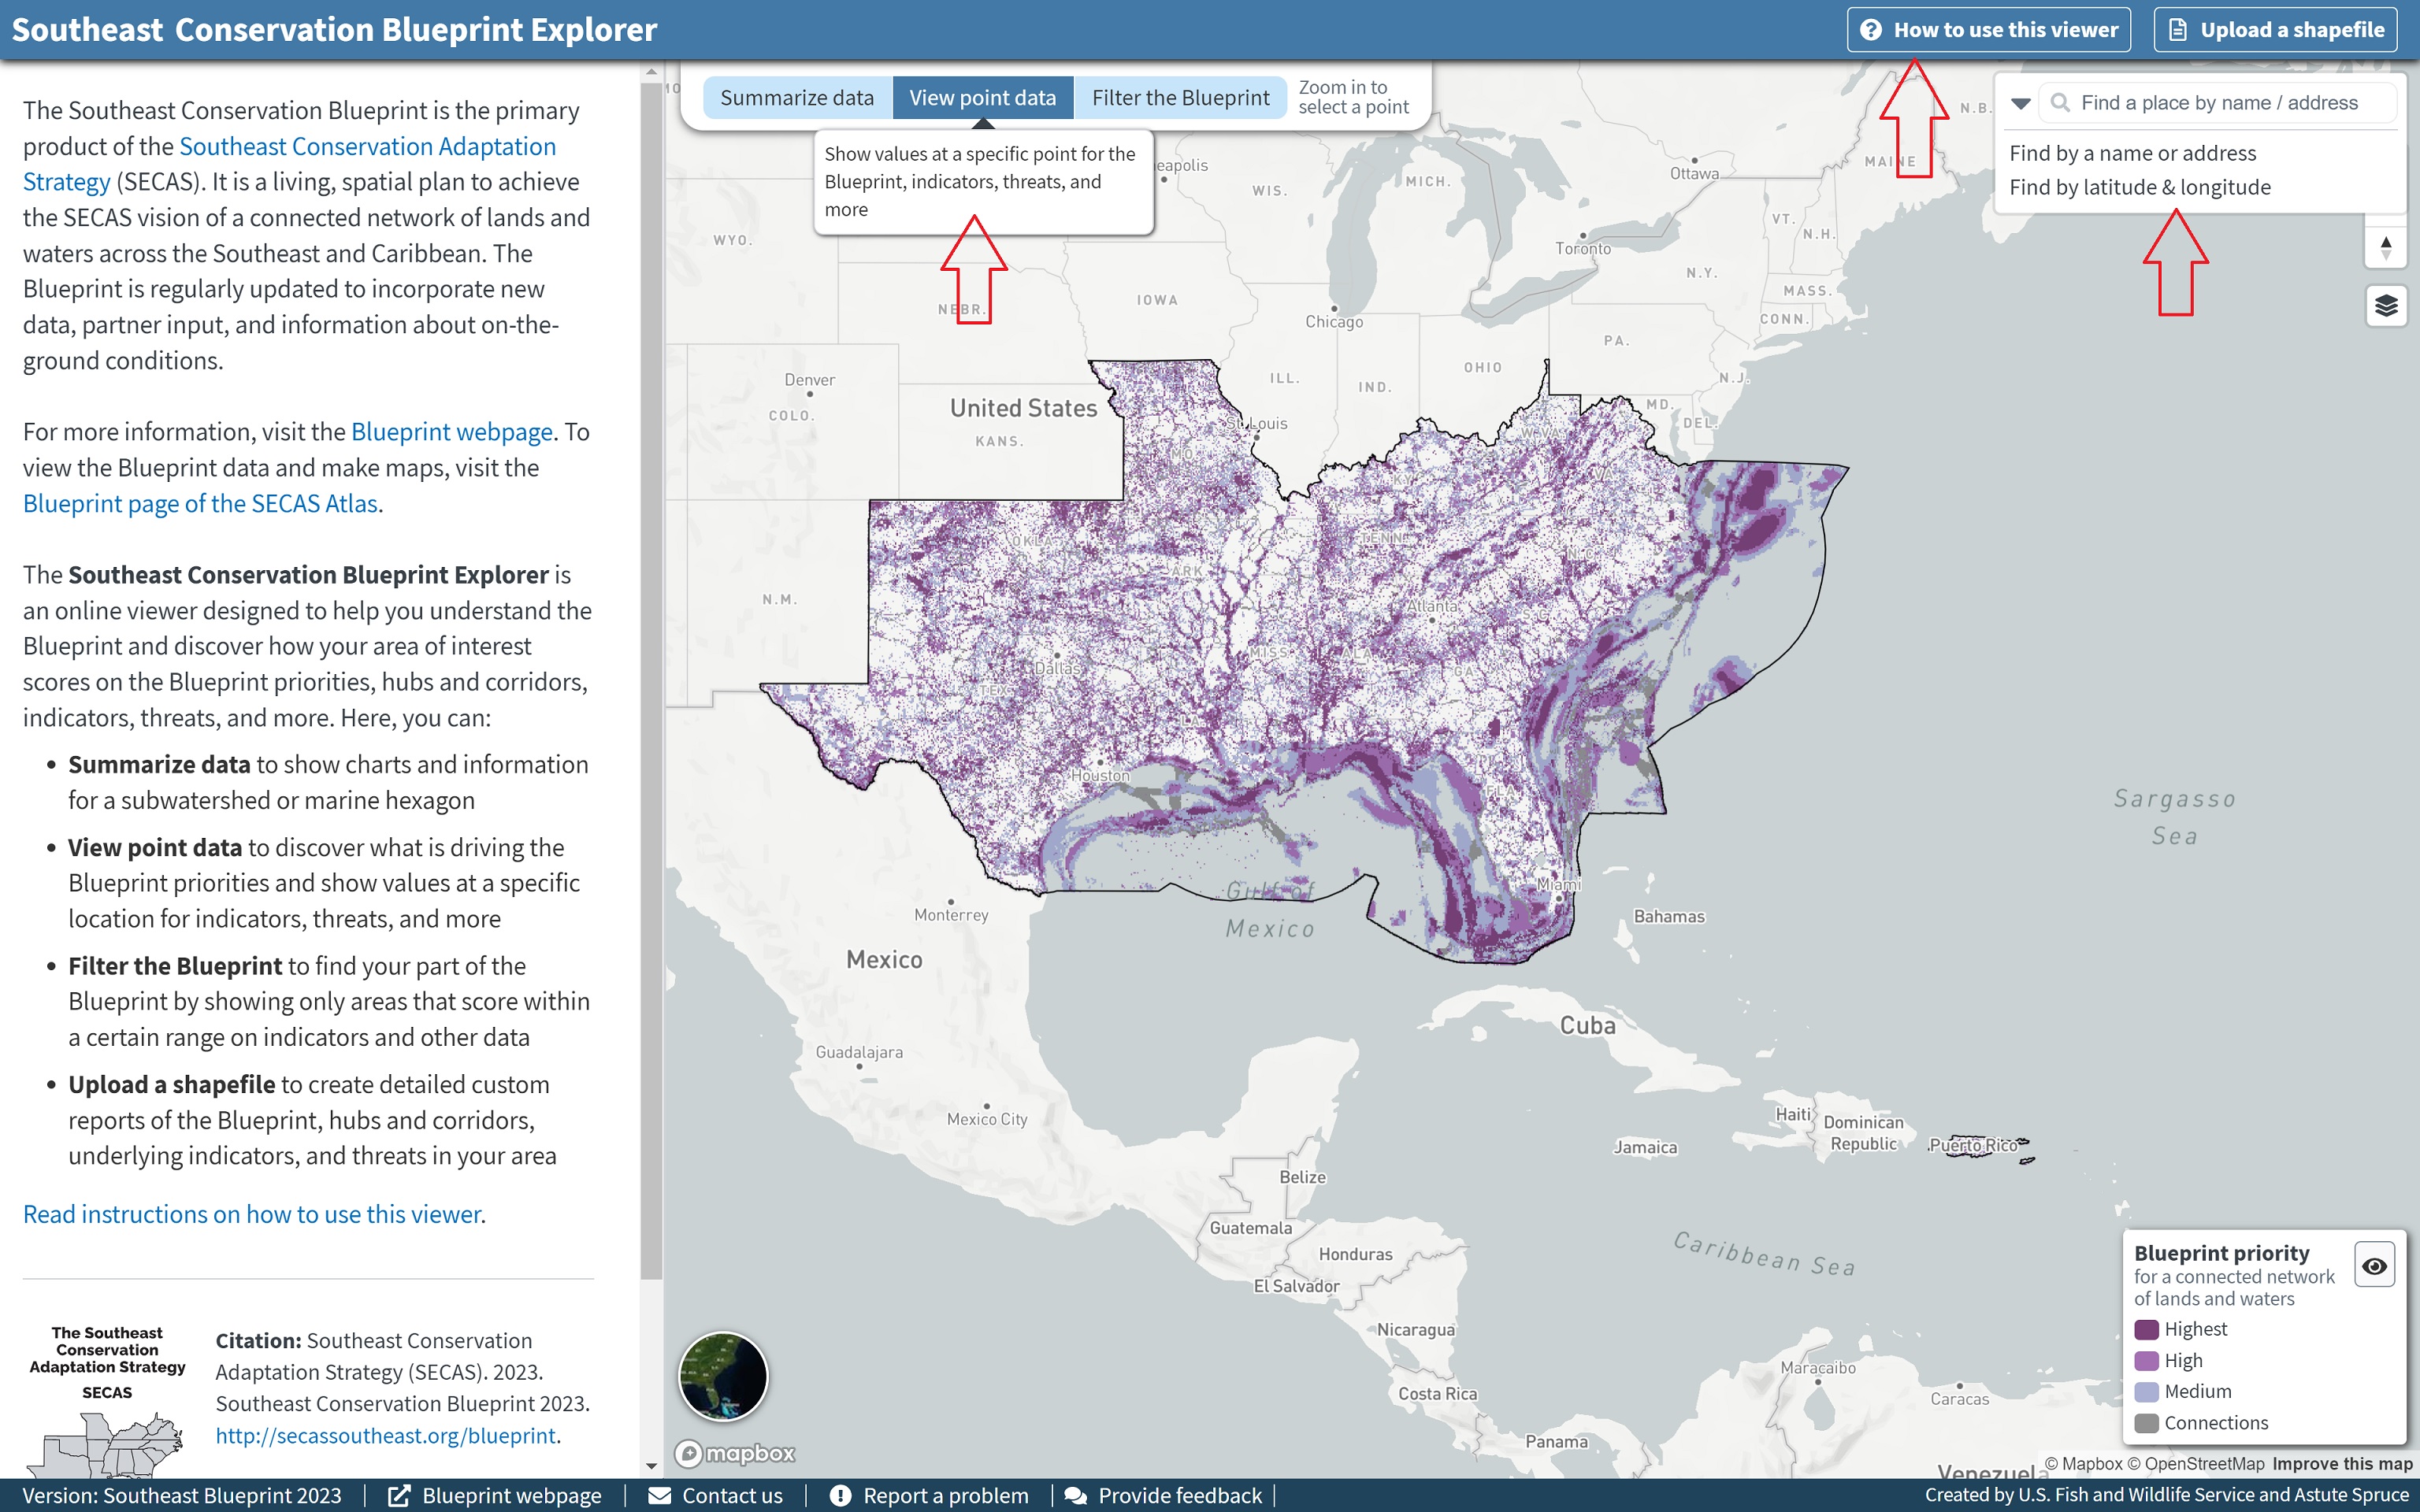
You’ll see new wording on the buttons for each mode, along with tooltips when you mouse over the button, to better clarify what each mode does.
The location search has moved from the introductory sidebar to the upper right of the map. This ensures the location search is accessible from all modes. It’s also a more intuitive place to find a feature that controls the map view. We also improved the search widget so it covers a more comprehensive range of locations. You can search by place names, addresses, and even coordinates (latitude/longitude)!
We also moved the instructions on how to use the viewer out of the sidebar. Those are now available from the top menu. We expanded the level of detail available in those instructions, and added screenshots. This makes the sidebar text shorter and easier to read, and provides a better step-by-step tutorial for those folks who like to read the directions before they try to assemble IKEA furniture–or use an online viewer.
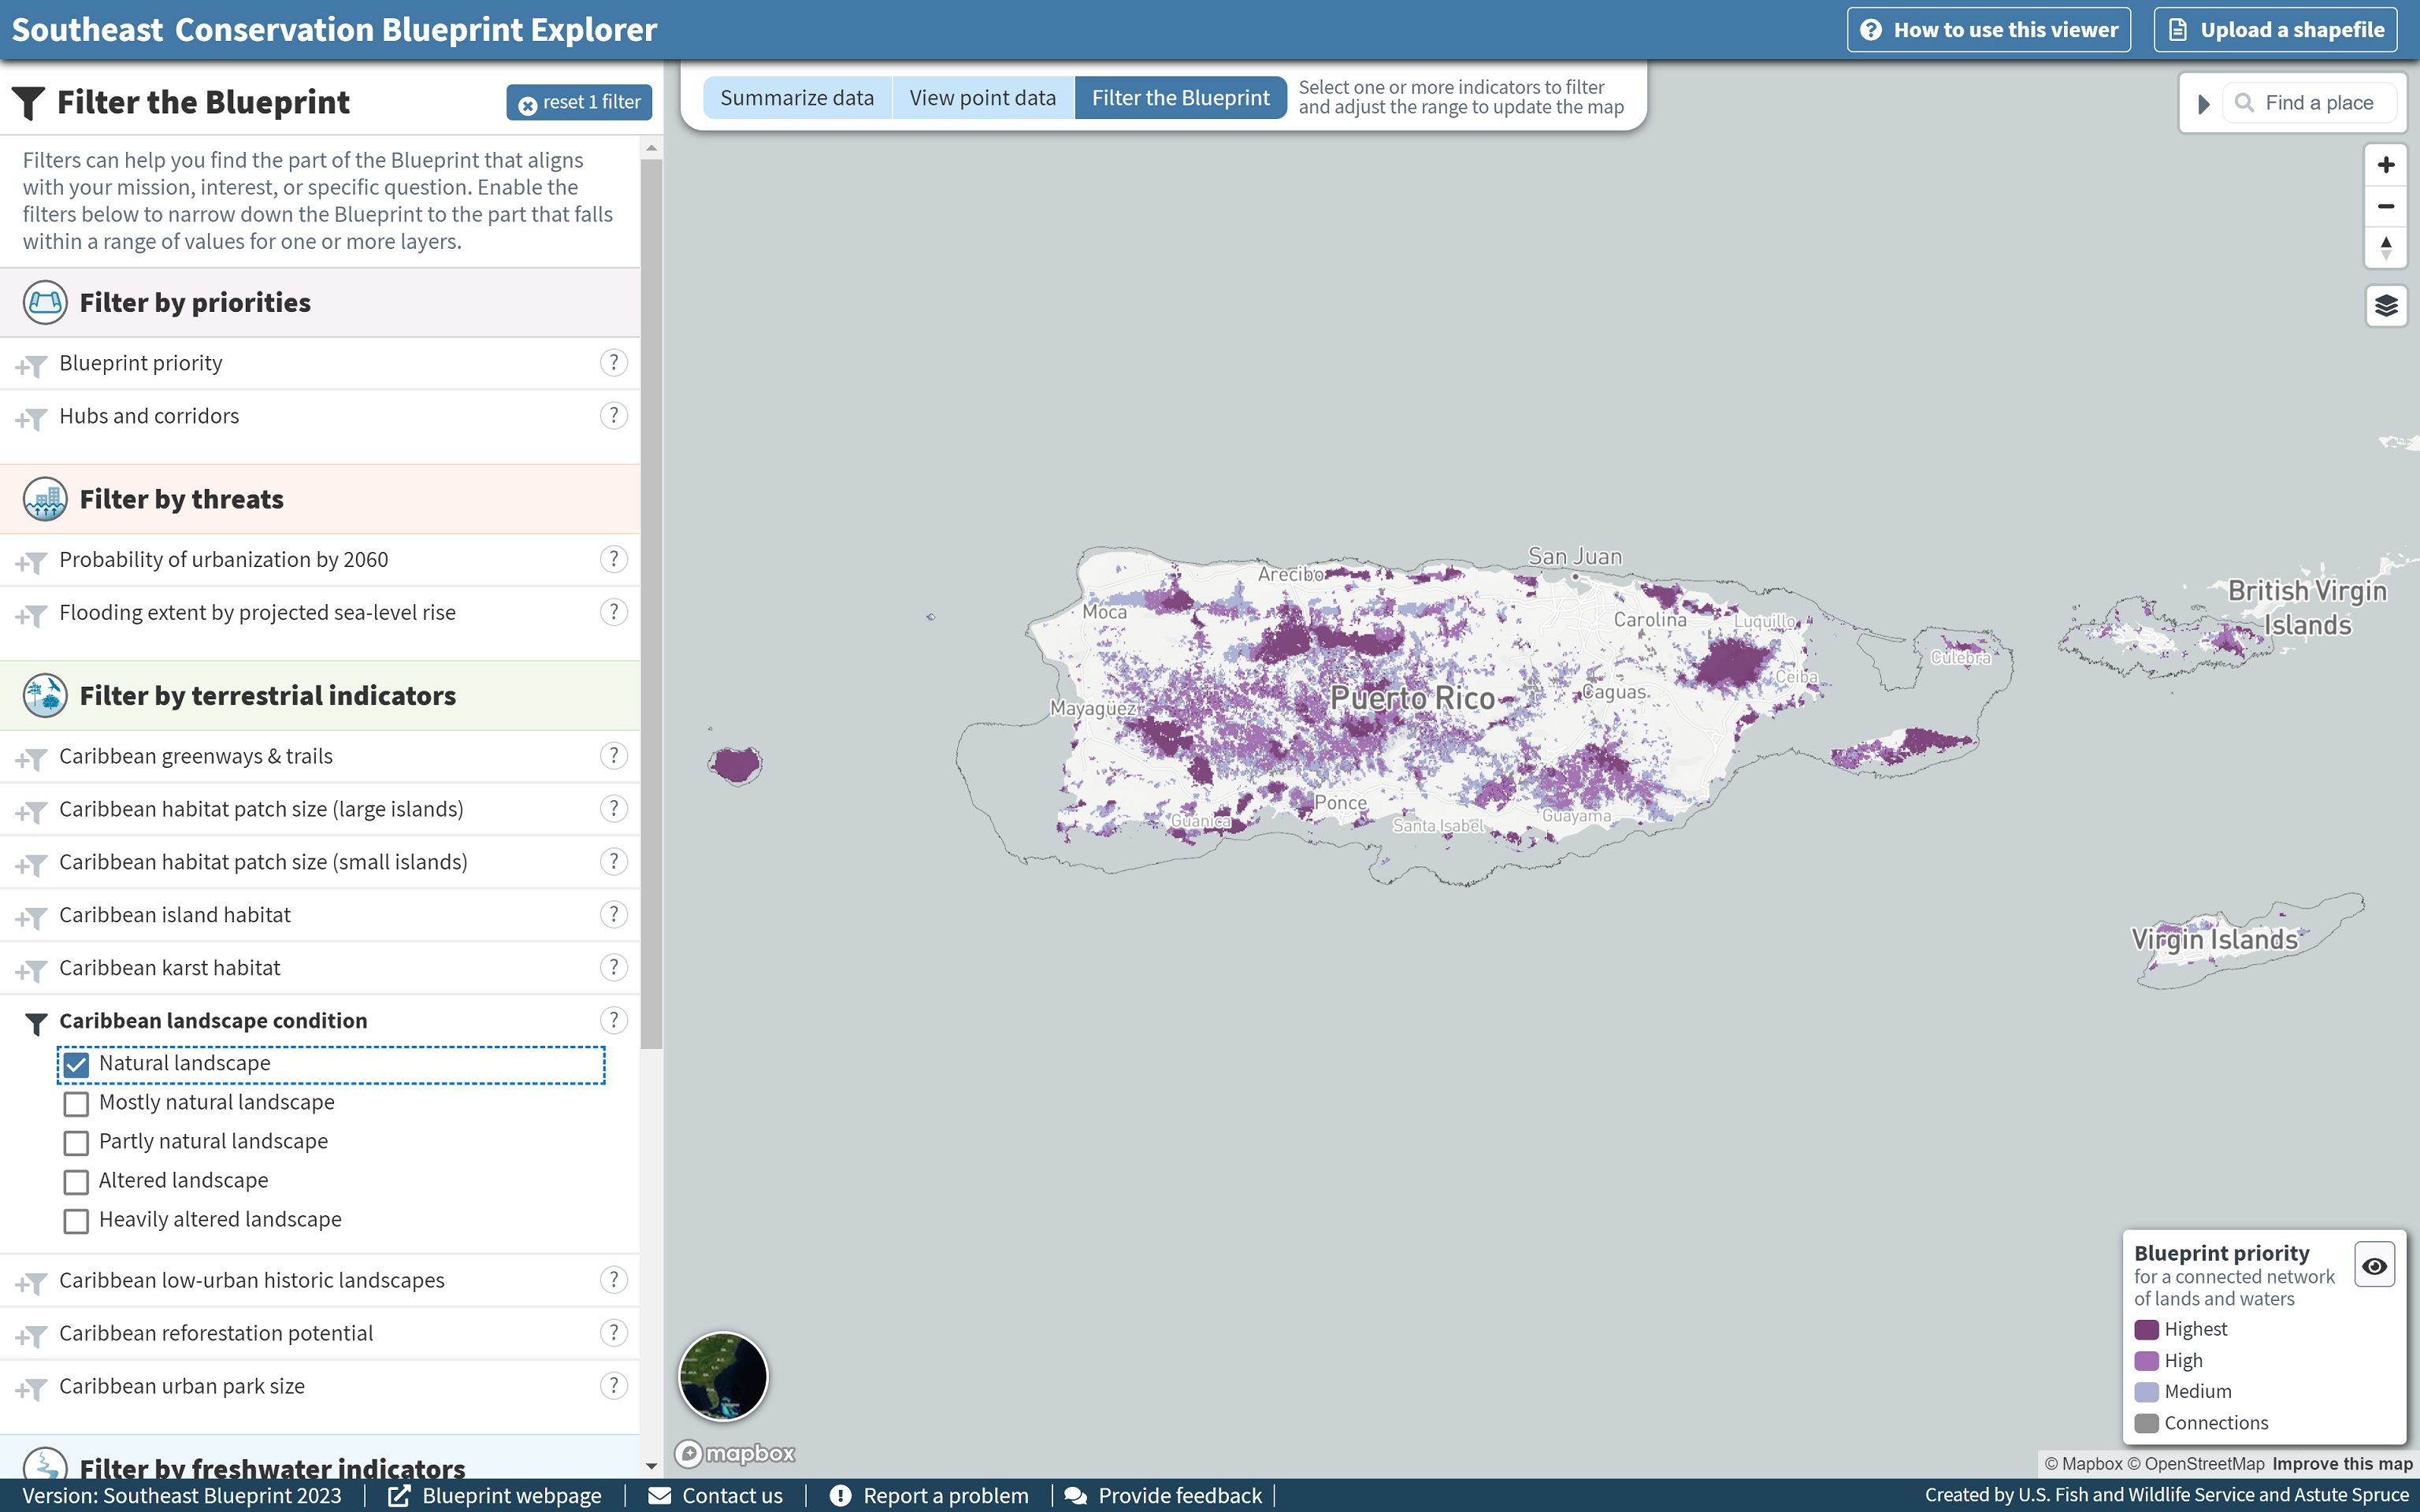
Last, but certainly not least, you’ll probably notice several changes to the pixel filtering mode, which was first released back in February of this year. The previous interaction required users to adjust slider bars to choose a range of values for the Blueprint, indicators, hubs and corridors and threat layers. The map would then update to show the part of the Blueprint that met those criteria. In user testing, it became clear that the slider bars confused many people, so we switched to a checkbox-style interaction that is more consistent with common practices for filtering search results on other platforms, like online shopping sites.
Now, you first click to activate a filter layer, and then check and uncheck the boxes to refine your filter criteria. This approach has several benefits:
- You can filter by non-contiguous values, like just the low and high ends of an indicator (leaving out the classes in the middle).
- It’s much easier to see the range of values that are available to choose from for a particular filter.
- Checkboxes make more sense than a range for indicators where the order of values isn’t immediately obvious (it’s fine when the range is 1 to 5 species, but it’s less clear when the range is known grasslands to grassland geology).
Another change to pixel filtering in this update is that the filter options available to you will change based on the area covered by your map window. For example, if you zoom into the continental United States, the Caribbean indicators will disappear to unclutter the sidebar. Similarly, if you zoom into the Caribbean, the continental indicators will automatically hide themselves. We hope this will help keep pixel filtering relatively simple despite all the new indicators that we added for Blueprint 2023.
We hope you find these updates and improvements helpful! We’d love to know what you think. Feel free to share any feedback with me at hilary_morris@fws.gov. And as always, if you’d like any help using Southeast Blueprint 2023 in your work, user support staff are here to help–for free! You can find contact information for the user support team on the SECAS staff page.
Last but definitely not least–huge thanks to Brendan Ward with Astute Spruce for his oustanding work designing the Explorer and updating the data!