Indicator spotlight - Equitable access to potential parks
The Southeast Conservation Blueprint identifies priority areas based on a suite of natural and cultural resource indicators that represent a variety of ecosystems. As the building blocks of the Blueprint, the indicators help show why certain places are important and help people find their part of this shared plan. The Blueprint and its indicators are completely data-driven and spatially explicit. Through an iterative cycle of testing and revision, we refine and improve these data layers based on extensive feedback from the conservation community.
So far, more than 2,000 people from over 500 different organizations have helped to make the Blueprint what it is today. And though we’re proud of the number of people who have provided feedback, attended workshops, met with us one-on-one, and helped to make the Blueprint better, SECAS staff are also conscious that these numbers don’t necessarily imply we’ve engaged a sufficiently broad and inclusive array of partners.
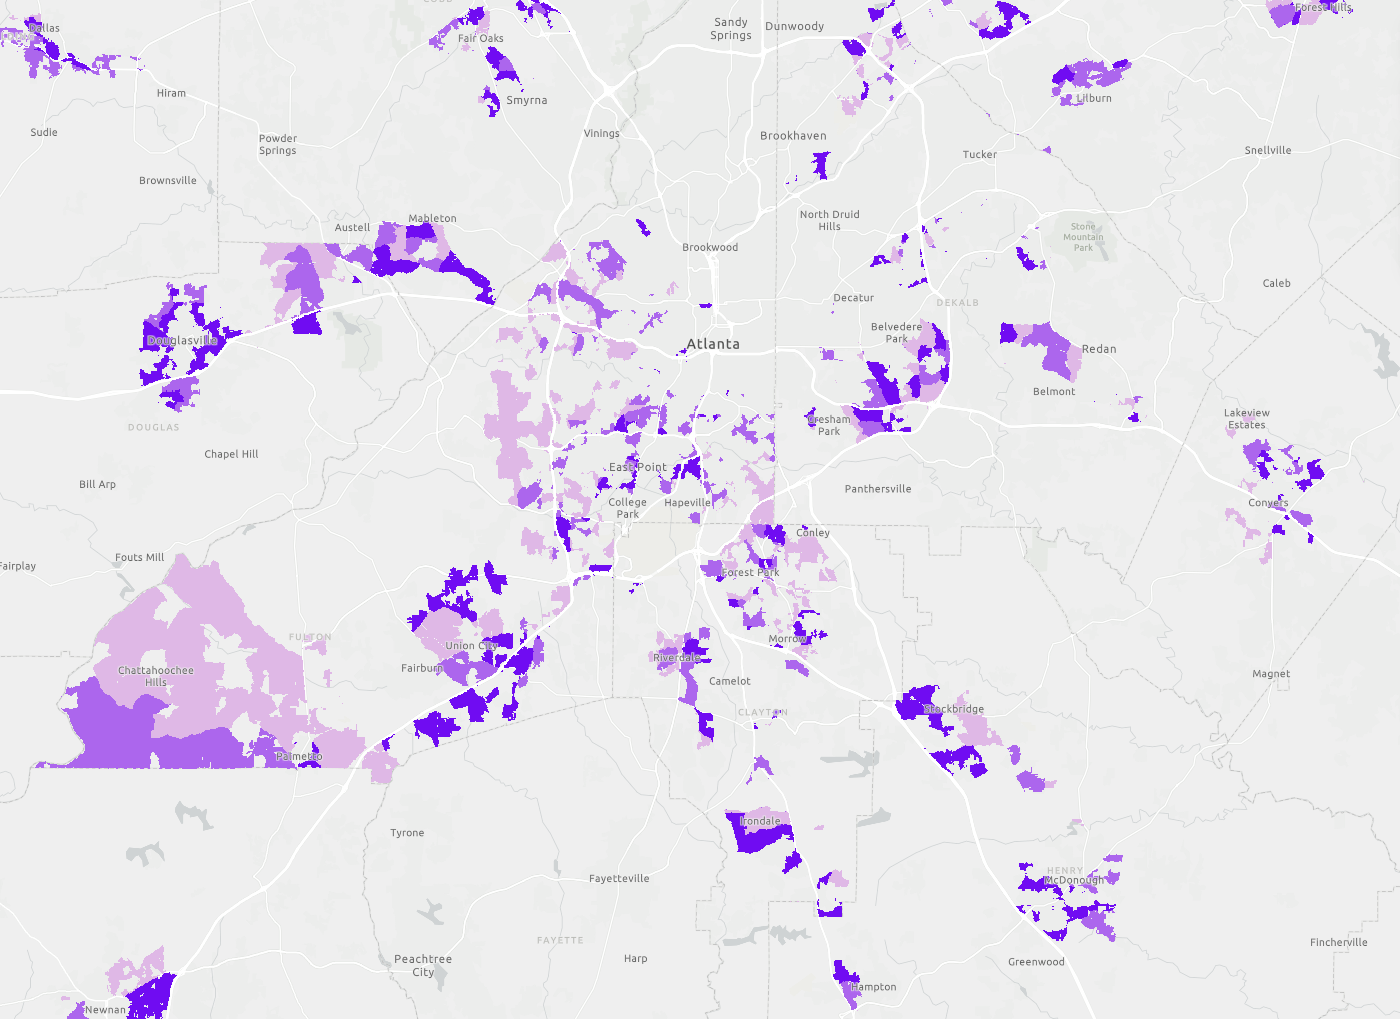
While the Blueprint has always included cultural resource indicators, in 2021, SECAS staff stepped up efforts to more directly represent the benefits that green space, parks, and nature provide to people. We began working on a new indicator, equitable access to potential parks, with the goal of driving Blueprint priority to places where developing a new park would fill gaps in access to open space within socially vulnerable communities. This indicator identifies areas where residents currently lack access to parks within a 10-minute walk (accounting for walkable road networks and access barriers like highways and fences), then prioritizes based on park need using demographic and environmental metrics.
We added this indicator out of the recognition that the distribution of parks and open space and the benefits they provide to people is not equal. Nationally, about one-third of the population cannot easily walk to a park. As a result, many people miss out on the benefits that come with living in close proximity to protected open space. Parks can provide physical and psychological health benefits to communities, as well as key ecosystem services like water filtration, air quality improvements, and offsetting heat island effects. As our climate changes, these services are becoming increasingly important.
In addition, parks help foster a conservation ethic by providing invaluable opportunities for people to connect with and have experiences in nature. For example, Central Park in New York City, one of the best know urban green spaces, supports more than 210 bird species. Located within the Atlantic Flyway, a critical East Coast migration route, Central Park serves as a migratory bird hotspot during the spring and fall. As the birds take advantage of the park to rest and forage, local residents and tourists come to appreciate the variety of species. According to NYC Audubon, Central Park is one of the “finest birding spots in the United States, attracting birders from all over the world.”

When we began to conceptualize this indicator, it quickly became apparent that we needed expert help. Although many SECAS staff members have experience in facilitation, conservation planning, ecology, and natural resource management, we aren’t experts in park planning or community engagement. Nor are we qualified to determine how best to identify the communities we wanted to serve with this indicator! We recognized that we needed to look beyond the bounds of the more traditional conservation community and lean on experts in the fields of community planning, equity, and social vulnerability. We let these experts guide our work, determine the best way to incorporate the available data, and recommend which factors to consider.
Through our research and conversations with experts, SECAS staff worked closely with The Trust for Public Land (TPL) and ultimately decided to use their ParkServe data. We started with TPL’s Park Priority Areas, a national dataset that identifies the top places within cities where the creation of a new park would help to close the national gap in park access. This layer prioritizes all populated areas in a city that fall outside of a 10-minute walk from a park based on six demographic and environmental variables: population density, the density of low-income households, density of people of color, community health, urban heat islands, and pollution burden. One great feature of ParkServe is that, rather than just considering distance from a park “as the crow flies”, the 10-minute walk service area reflects the availability of walkable roads, factoring in barriers like highways, train tracks, and rivers that don’t have bridges. To learn more about how TPL defines its park priority areas, visit the ParkServe website.
To further refine this indicator and ensure it captures places where a new park would directly benefit underserved communities, we also incorporated the Center for Disease Control’s Social Vulnerability Index. Social vulnerability represents the capacity for a person or community to “anticipate, cope with, resist and recover from the impact” of a natural or anthropogenic disaster, like extreme weather events, oil spills, and fires. Adding in the social vulnerability data helped to limit the indicator to only show park priorities in areas with high social vulnerability. More information about this dataset is available on the CDC website.
While we recognize that this indicator is still far from perfect, we are excited to think more intersectionally about the way we do conservation in the Southeast. We’re already getting great feedback from Blueprint users! For example, the Nature Conservancy in Texas was excited to see this indicator in the Blueprint when they used it to inform their statewide strategic plan, which will help guide their conservation priorities in the coming years. Our partners with Georgia and South Carolina Audubon have used the Blueprint and this indicator to strengthen grant proposals and develop organizational priorities that highlight the intersection of climate resilience and access to green space. In addition, a group of local business leaders in Georgia, in partnership with Columbus State University, used the Blueprint to identify areas of avoidance for development planning, including the equitable access to potential parks indicator as one of the environmental justice layers in their analysis.
As with all things about the Blueprint, SECAS staff will continue to refine and improve this indicator over time. Blueprint 2023, which was recently released, updates the priorities for Puerto Rico and now covers the U.S. Virgin Islands for the first time. TPL also recently updated their ParkServe data and expanded it to Puerto Rico. SECAS staff can now explore applying this indicator to the U.S. Caribbean in future versions of the Blueprint. SECAS staff are also looking for other data sources to inform this indicator for the U.S. Virgin Islands and will be working with local researchers and experts to find the most appropriate information to include.
If you’re interested in digging deeper into this indicator and others, please check out our underlying data on the Blueprint page of the SECAS Atlas—or even better, reach out to a user support specialist!