New developments in understanding coastal marsh change in the Southeast
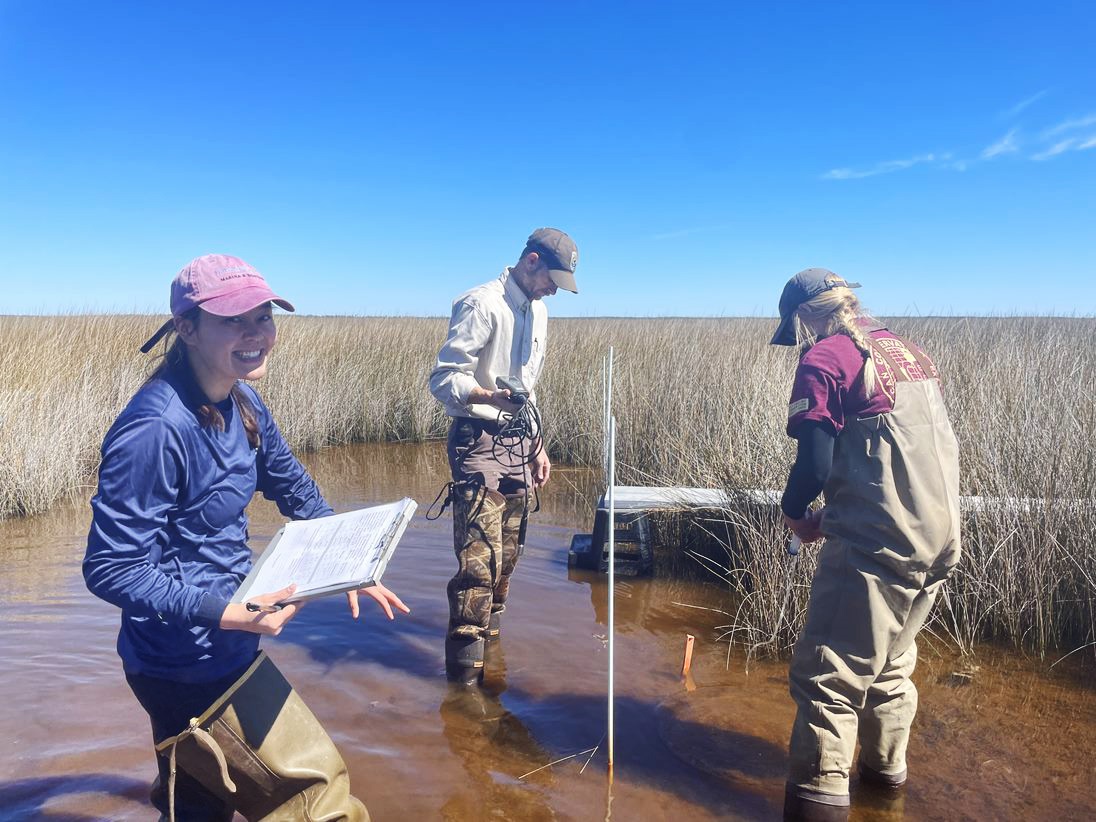
Coastal managers need information about which wetlands are most vulnerable to sea-level rise in order to prioritize adaptation efforts. To support this prioritization, the Inventory and Monitoring branch of the U.S. Fish and Wildlife Service—along with many wetland researchers, managers, and biologists—have been sampling Surface Elevation Tables (SETs) on National Wildlife Refuges (NWRs) across the country. A SET is a portable mechanical leveling device for measuring the relative elevation change of wetland sediments (see video for a brief description of how this works). SETs are the only tool that allow for millimeter-scale precision of elevation measures in wetlands, which is the same scale at which changes in sea level are measured. SET data is one piece of information that can help predict wetland resilience to current and future sea-level rise, and aid in prioritization of sites for restoration.
Threats to coastal wetlands, including sea-level rise and subsidence, led the NWR System to protect over 500,000 hectares of coastal wetlands during the twentieth century, with approximately 20% occurring in the South Atlantic geography. Will They Stay or Will They Go–Understanding South Atlantic Coastal Wetland Transformation in Response to Sea-Level Rise is a regional synthesis of 10 years of SETs and marker horizons (sometimes abbreviated SET-MH) from 21 sites on 19 Refuges in the South Atlantic that are part of the Coastal Wetland Elevation Monitoring (CWEM) Network. Of these sites, only six were currently gaining elevation at a rate that was equal to or greater than the long-term rates of sea-level rise and therefore considered resilient. Of those sites, only the oligohaline marshes at Waccamaw and Currituck NWRs were gaining elevation at a rate that exceeded sea-level rise by 1 mm/year. These results support the mounting evidence that many coastal wetlands, particularly in the South Atlantic geography of the United States, will undergo ecological transformations in the next several decades.
One limitation of SETs is that they are labor-intensive to measure and deploy, so often they are limited in their spatial coverage. Conversely, integrated spatial metrics based on remote sensing provide comprehensive spatial coverage of horizontal processes, but cannot track elevation trajectory at high resolution. Horizontal Integrity a Prerequisite for Vertical Stability: Comparison of Elevation Change and the Unvegetated-Vegetated Marsh Ratio Across the Southeastern USA Coastal Wetlands is a collaborative research project with the U.S. Geological Survey (USGS). Here, researchers present a critical advance in reconciling vertical and horizontal dynamics by assessing the relationship between elevation change, relative tidal elevation, and the unvegetated-vegetated marsh ratio (UVVR) across coastal wetland complexes in the southeastern United States.
You might recognize the UVVR concept and data from the stable coastal wetlands indicator used in the Southeast Conservation Blueprint! Dr. Neil Ganju presented on this work at a Third Thursday Web Forum last May (check out the recording of that webinar to learn more).
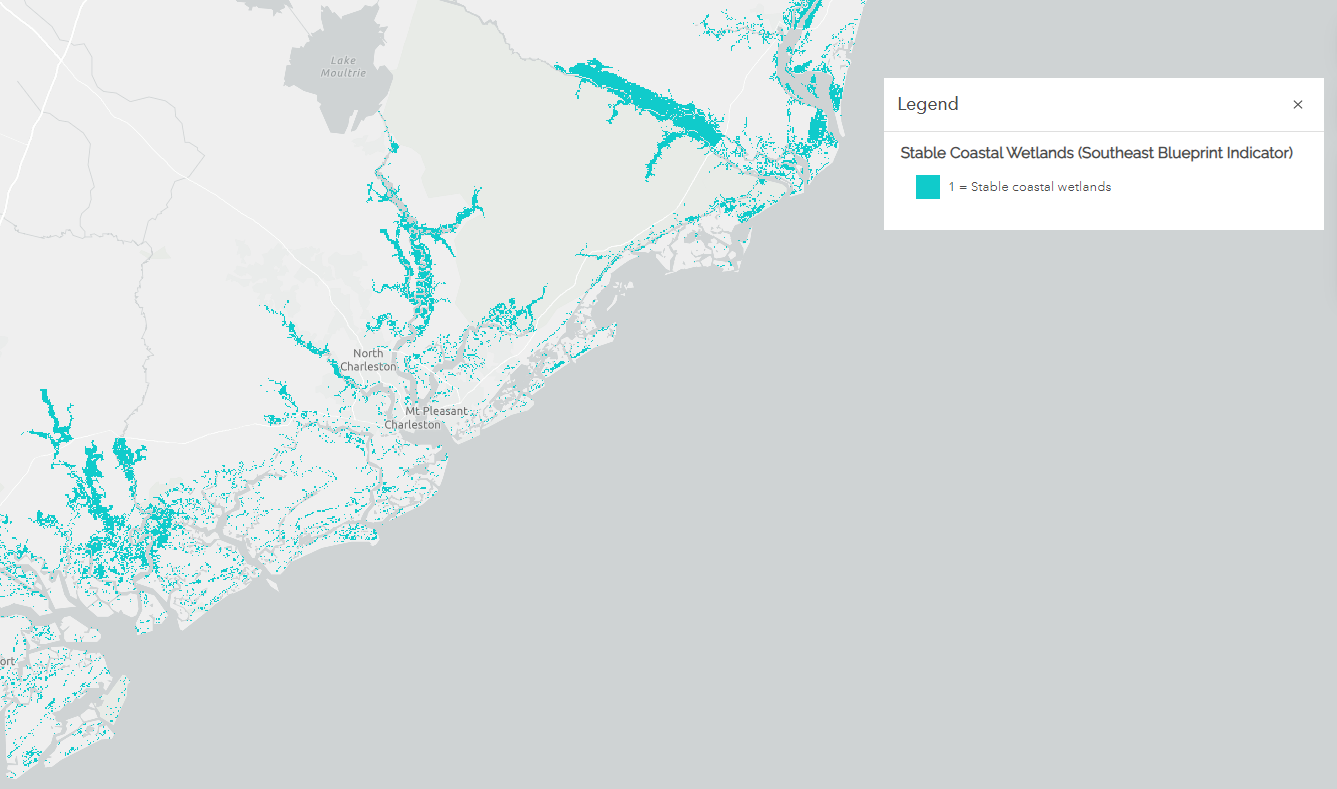
The results demonstrate the CWEM data correlate well with the UVVR data in the coastal marshes of Southeast Refuges, which suggests that using this Landsat-derived GIS layer could be a suitable, landscape-scale monitoring tool for measuring marsh vulnerability. Additionally, this metric requires significantly less staff capacity than SETs. Yet, we do recommend that we still maintain a network of CWEM reference sites when capacity and resources permit that monitoring to occur. It also should be noted that this technique of using UVVR to evaluate marsh vulnerability did not work at our forested wetland sites due to canopy cover.
This year, the U.S. FWS Refuge System is collaborating with USGS and another FWS program, Science Applications, to develop a map viewer that incorporates SET-MH and UVVR data for the CWEM network on Southeast Refuges. This project serves as a pilot for looking at SET-MH data and the UVVR at the national scale. Lessons learned will be used to improve how the Southeast Blueprint uses UVVR data in its stable coastal wetlands indicator.
In particular, we are exploring issues related to coastal wetland transformation with Refuge staff and their partners at Waccamaw, Coastal NC, Southeast LA, and Ten Thousand Islands NWRs and assessing how the data can help better inform management decisions. These real-world examples—which will focus on identifying, implementing, and monitoring RAD (resist-accept-direct) strategies that can help manage for ecological transformation of coastal wetlands—will be shared through a story map. Our first case study is at Waccamaw NWR and we’ve received this preliminary feedback on the UVVR-SET mapping application from NWR manager, Craig Sasser:
“I would have to say, from my perspective for the Refuge, that we’ve been trying to get an expansion for Waccamaw since around 2008 when we completed our Comprehensive Conservation Plan (CCP). After we completed the CCP, we worked with partners on making documentary videos about climate change and habitat loss, as well as magazine articles and all kinds of jazzy things to tell our story. I was asked along the way by our Regional Chief where we should be in regional refuge expansion priorities while doing a detail as the Regional Chief of Realty. I replied that I wanted to put the best available science into our planning needs before we were ready to move forward. Since then, we have completed a Landscape Conservation Design and Land Protection Plan. Even with these tasks completed, we never could get any traction for a major expansion. We even created a new Realty tool called a Minor Boundary Modification to allow for some key habitat protection efforts to move forward. So, if we can use something like this [UVVR-SET application] in the spatial habitat management plan to actually facilitate an expansion, then this would be the greatest moment of my career.”
For more information regarding SETs, the SET-UVVR mapping project, or how this information can better be used to inform your understanding of coastal wetland transformation, please contact Michelle Moorman at michelle_moorman@fws.gov.