Guess some trends in Southeastern ecosystem indicators
I’ve been having a great time synthesizing recent trends in Southeastern ecosystem indicators. It’s part of this year’s report on progress toward the SECAS 10% goal, which is a major part of the upcoming symposium at SEAFWA this fall. There are lots of interesting results that you’ll hear about soon.
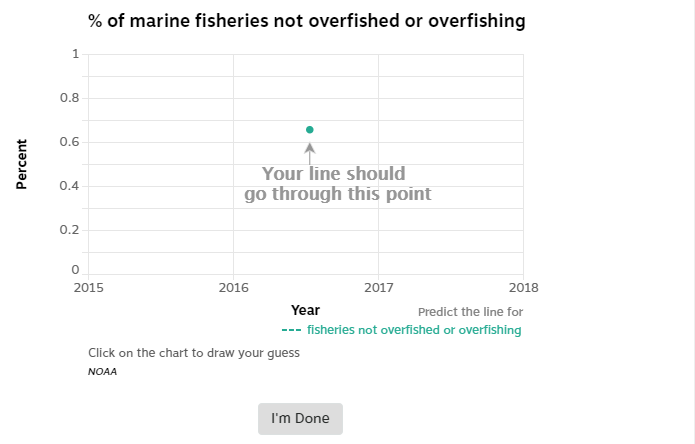
In the meantime, here’s a fun activity based on two of those indicators. Hopefully, you’ll see two different graphs below. You start by guessing the trend, then you can see what the data say, and then what other folks guessed.