Improve the Blueprint by mapping the places you know and love with OpenStreetMap
As you have probably heard SECAS staff say many times, one of the guiding principles of the Southeast Conservation Blueprint is “do not duplicate the good work of others.” Part of acting on this principle is building the Blueprint from existing data. You may be aware of some of the species and habitat data that we bring in from places like the U.S. Geological Survey or the Southeast Aquatic Resources Partnership. Today I’d like to highlight another data source, OpenStreetMap (OSM).
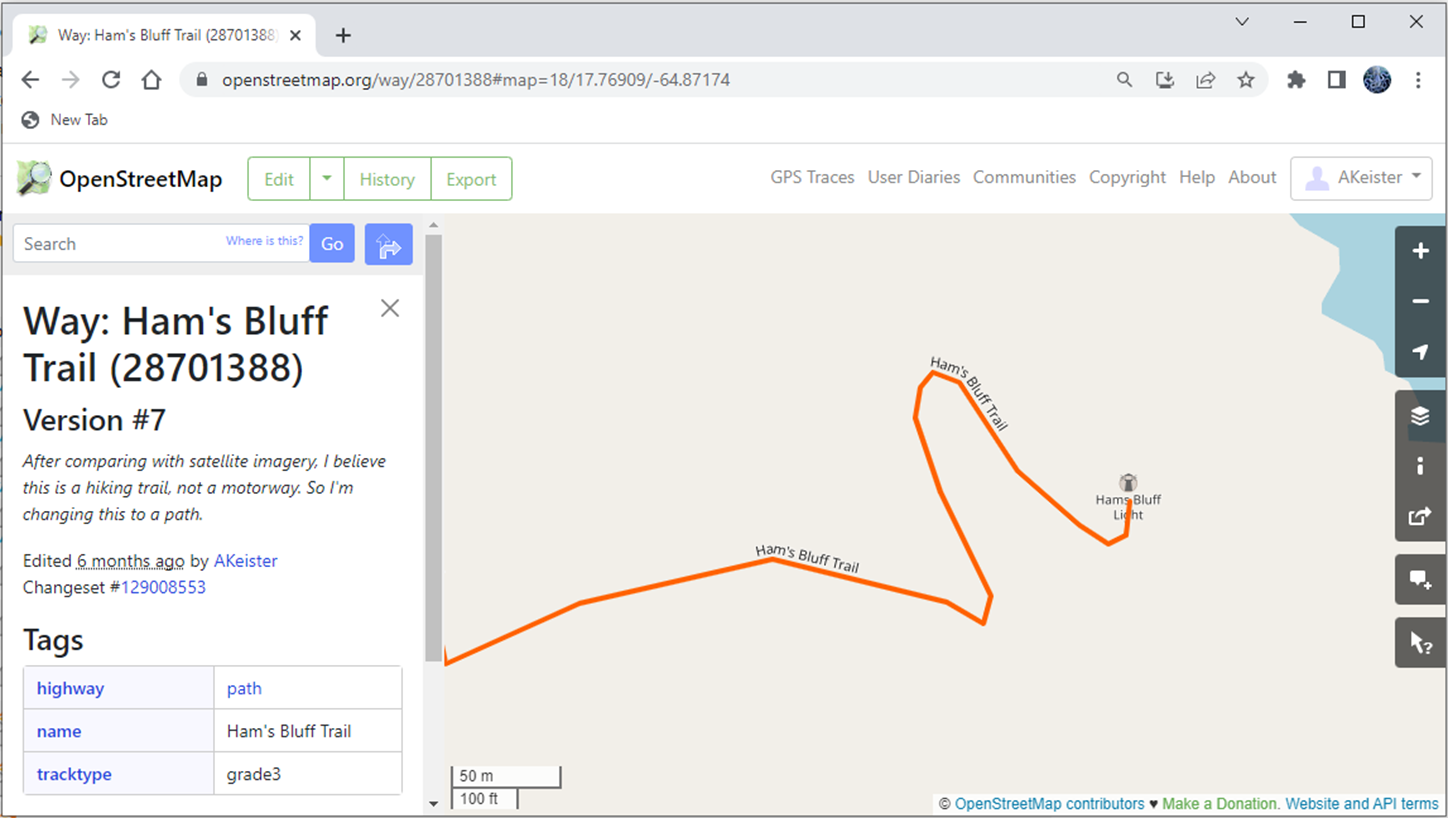
OSM is a community-driven source of spatial information. People all over the world contribute to this project to verify that these data are updated and accurate. This is what is called an “open data” project, which means you are free to use the data if you credit OSM. It also means that you can contribute to the data, using your own local knowledge to improve the spatial depiction of your community.
In the Southeast Blueprint, we started using the street layers of OSM to help identify highly altered areas in the Southeast, and quickly found these data helpful for indicator development. The first indicator where we used OSM data is greenways and trails. The Southeast Blueprint covers a large area of the United States, including 15 Southeast states and 2 Caribbean territories. We do not have the staff time to collect and assemble trail data from all the states, federal agencies, and local communities across this enormous area. And even if we did, we are not set up to maintain and update such a database. Luckily, we don’t have to, because of the OSM project!
The trail data in OSM is not exhaustive—there are missing trails. But don’t fret! When you find a missing trail, you can just…add that trail to the database! This aspect of OSM is what makes it so helpful as a data source for the Southeast Blueprint. When a user identifies a missing trail, they are able to use their local knowledge to update the OSM data themselves. Then, in the next Blueprint revision cycle, we just pull down the latest OSM data and update the indicator. Then that trail isn’t missing anymore! If you have ever found yourself waiting 1, or 2, or 5 years for the next release of a regional or national spatial dataset, you know how powerful that is. The data that our users add to OSM aren’t just available for the Southeast Blueprint—they become available to the whole OSM community. Instead of being locked away on some internal server, never to see the light of day again, they’re accessible to everyone almost immediately.
This ability to crowdsource data became even more important this year when we moved to update the Caribbean portion of the Blueprint. Those of you who work in the U.S. Caribbean know that, even though these are U.S. territories, they are not provided with the same spatial data resources as the 48 states that comprise the contiguous United States. Those base spatial layers that you may have learned to rely on often aren’t there. You may, like me, find yourself thinking “I’ll just pull up the National Landcover Dataset (NLCD) to get a general overview of the vegetation.” Oh, you sweet summer child, you won’t be doing that, because the NLCD doesn’t cover Puerto Rico or the U.S. Virgin Islands! And sometimes, even when a dataset covers these areas, it isn’t as detailed or thorough as what we have come to expect from national and regional datasets in the contiguous United States.
The data disparities between the contiguous Southeast and the Caribbean have motivated us to expand our use of OSM data in the draft Caribbean indicators. These indicators will be used to update the 2023 Southeast Blueprint. Once again, we used OSM for the greenways and trails indicator, this time in the Caribbean geography, to identify trails and sidewalks. We also used OSM parks and beaches data to enhance the other data sources in our Caribbean urban park size indicator. For our Caribbean low-urban historic landscapes indicator, we used the “historic” tag on OSM polygons, along with other data, to improve the representation of historically significant sites. While this update cycle in the Caribbean has highlighted the need for locally sourced knowledge, I expect we will continue to expand our use of OSM across other parts of the Southeast Blueprint in the future. OSM is a powerful project that allows local contributors, who are experts in their own communities, to share their spatial knowledge of the places they call home.
We are finding the local knowledge aspect of OSM so compelling that we will be talking about it in the August Third Thursday web forum. This forum will be an opportunity to learn how you can contribute your own local knowledge to the OSM project, thereby helping us to improve some of the Southeast Blueprint indicators. The more people we have trained up on reviewing and contributing to the OSM project, the better we will be able to represent important aspects of your community in the Blueprint. I have to warn you, it is surprisingly fun to check to see how the places you know and love are represented, and to update or add features that haven’t been captured yet. I hope you all can join us for this Third Thursday Web Forum on August 17th at 10 am ET: Putting your community on the map: Digitizing local natural and cultural resources with OpenStreetMap.