New features added to the Blueprint Explorer viewer

We recently added two new and exciting features to the Southeast Conservation Blueprint Explorer viewer: filtering the Blueprint by the underlying indicators, and viewing different data layers on the map. As a reminder, the Explorer is a simple online interface designed to make it easy to discover how a particular area is scoring in the Blueprint, and why. Back in December, I talked about the new pixel data mode that allows you to drill into the smallest unit of the Blueprint analysis–a 30 m by 30 m square pixel–and find out what’s driving the priorities.
With the addition of filtering, there’s now a third button to the top toggle that says “pixel filters”. Filtering can help you find the piece of the Blueprint that aligns with your mission, interests, or specific question. The piece of the Blueprint is a key concept here–filtering is designed to look within the Blueprint priorities.
Let’s say you’re interested in regional connectivity–maybe you’re looking for the best places to install a new wildlife road crossing. You could start by identifying the parts of the Blueprint that fall within a hub or a corridor in the underlying connectivity analysis! Now with one click, you can filter the Blueprint by the hubs and corridors.
Alternatively, maybe you’re looking for the best places to restore riparian buffers. You could start by filtering the Blueprint by natural landcover in floodplains! The best candidates for restoration might be places where the amount of natural landcover has some room for improvement (where it isn’t already in the best condition). Just use the slider to select all the indicator values outside the top naturalness class. The resulting map shows the parts of the Blueprint that score in that lower range for this indicator.
You’re welcome to mix and match different filters! Do you want to see where those riparian buffer restoration opportunities would also contribute to reforestation priorities for forest breeding birds in the Mississippi Alluvial Valley? Turn on both filters and adjust the slider to your desired range! Keep in mind that these filters are what’s known as “AND” filters, meaning the results represent areas where all filters apply. For example, if I were shopping for a new pair of hiking boots on a shoe store website, I might want to filter my results to show only shoes that are hiking boots AND a size 8.5 AND waterproof. I’d want to see the intersection of all those variables–otherwise I’d get results for shoes that don’t meet my criteria, like styles that aren’t available in my size. This means that if you choose filters that do not have any spatial overlap (like South Atlantic maritime forest and Great Plains perennial grasslands), you’ll see a blank map.
The pixel filters and pixel data modes work together on the same underlying framework, so once you’ve turned on filters, you’ll keep that same map view once you toggle back over to pixel data mode. That means you can filter to find a subset of the Blueprint, and then switch over to pixel data to drill into that portion of the map. If you still have filters selected while you’re in pixel data mode, an orange button at the top of the sidebar (you can see it in the above screenshot) will remind you how many filters currently apply to your map view. You can clear the filters using that button while in either mode. Just keep in mind that summary mode works totally differently, so when you switch to summary mode, you’ll go back to seeing the whole Blueprint map.
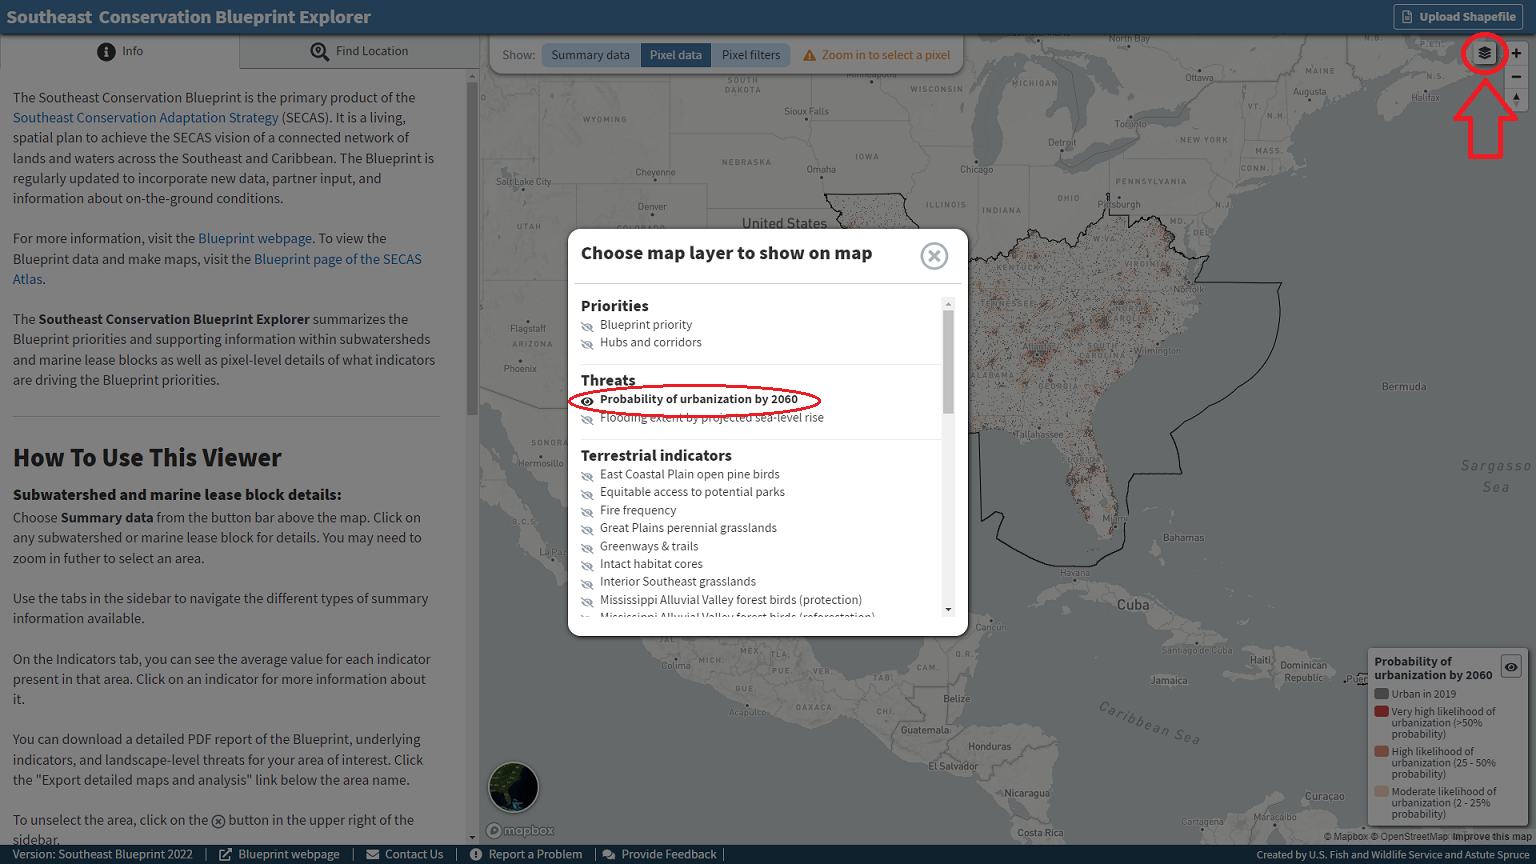
That brings me to the second major new feature! We also added a layers button at the top right of the Explorer–available in pixel data and pixel filters mode–that allows you to view other underlying datasets beyond just the Blueprint. Once you click on that icon, use the eye to select other layers, like the indicators, hubs and corridors, and sea-level rise and urban growth threats. This is the first time the viewer has supported showing map layers other than the Blueprint priorities, so this little button is kind of a big deal! Be aware that you can view different layers as you filter, as well, which can add complexity if you’re filtering by one layer while looking at another. You can always go back to showing the Blueprint if that feels a bit overwhelming.
Like everything else related to the Blueprint, the Explorer is a living product and very much a work in progress! Do you have feedback on these new features? Do you love them, find them confusing, or have ideas on how to improve them? Please reach out and let me know at hilary_morris@fws.gov. I’d love to hear from you.
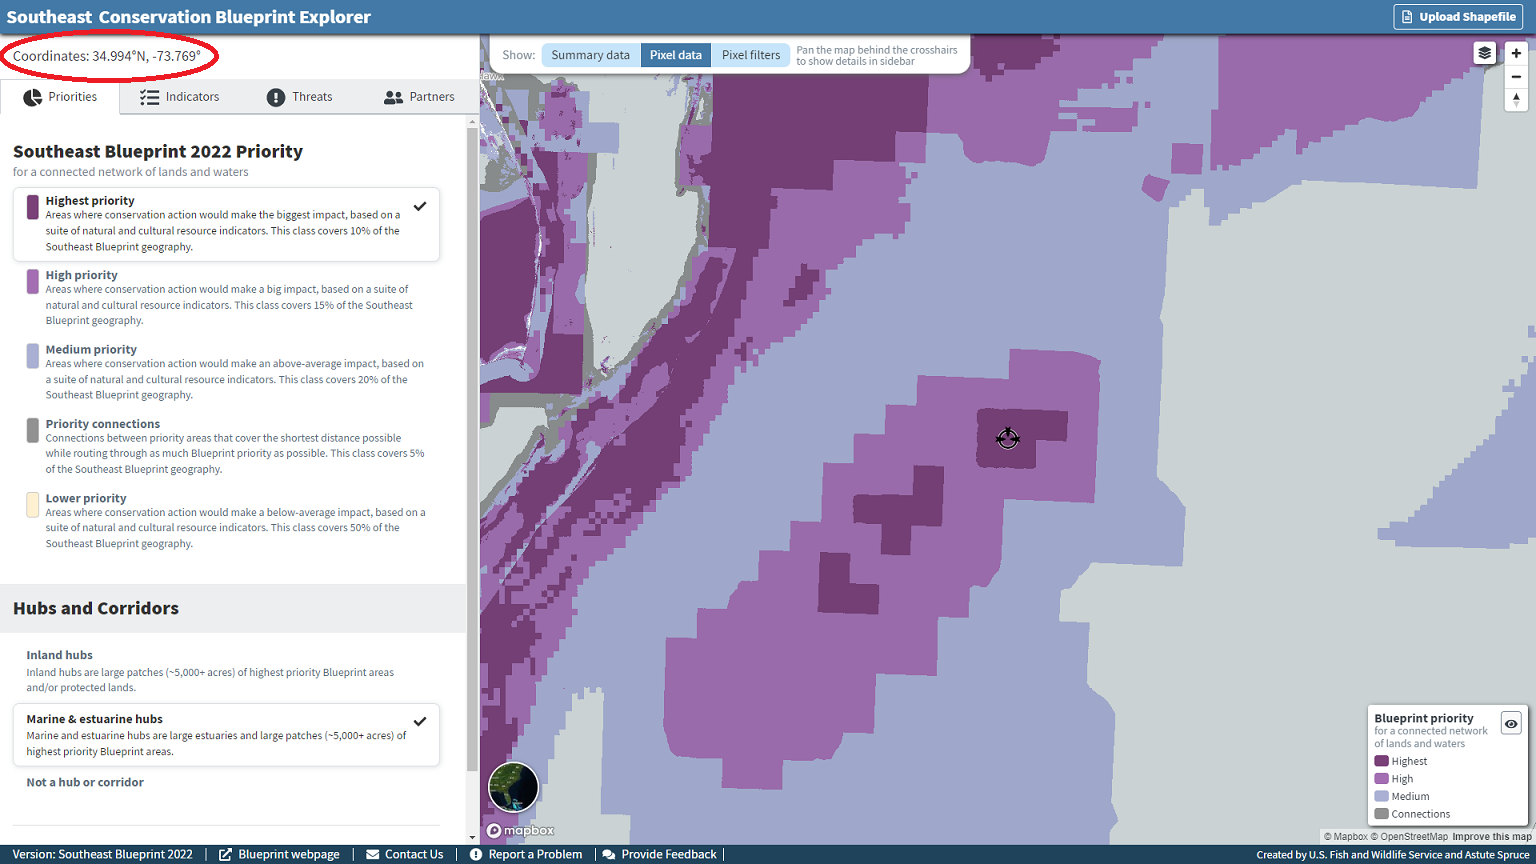
We really do take viewer feedback to heart! Here’s a real example. A user reached out because they needed to pinpoint precise coordinates within the Explorer as part of reviewing potential offshore wind energy projects. It’s a lot harder to orient from just a basemap out in the marine environment than it is on land! To address that feedback, we now show the lat/long of the bulls-eye in pixel mode.
If you want to learn more, on the next Third Thursday Web Forum, I will give a live demo of the Blueprint Explorer. Please tune in to see these new features in action and participate in what I hope will be a lively Q&A and discussion.
As always, I owe a big shout-out to Brendan Ward of Astute Spruce, the software developer behind the Blueprint Explorer, for his amazing work. And don’t forget, you can always reach out to a member of user support staff for help! We’d love to work with you and learn more about your project.