From the archive - The Nature Conservancy in South Carolina uses the Southeast Blueprint to identify their statewide priorities
Earlier this year, The Nature Conservancy (TNC) in South Carolina started using the Southeast Blueprint to inform an update of their South Carolina Conservation Vision, which is their statewide map of conservation priorities. The state of South Carolina contains two different Blueprints—the South Atlantic Blueprint and the Appalachian NatureScape Merged Design. The Southeast Blueprint provided the seamless statewide coverage TNC needed because it already integrates those subregional priorities into one priority layer.
TNC’s South Carolina Conservation Vision hadn’t been updated since 1998, so it was due for a refresh to incorporate advances in conservation planning, threat projections, and connectivity modeling. The timing of this update also coincided with the reauthorization of the SC Conservation Bank, a major funding source from the SC state legislature. An early draft of the new vision was used to help support the reauthorization, which was finalized in May.
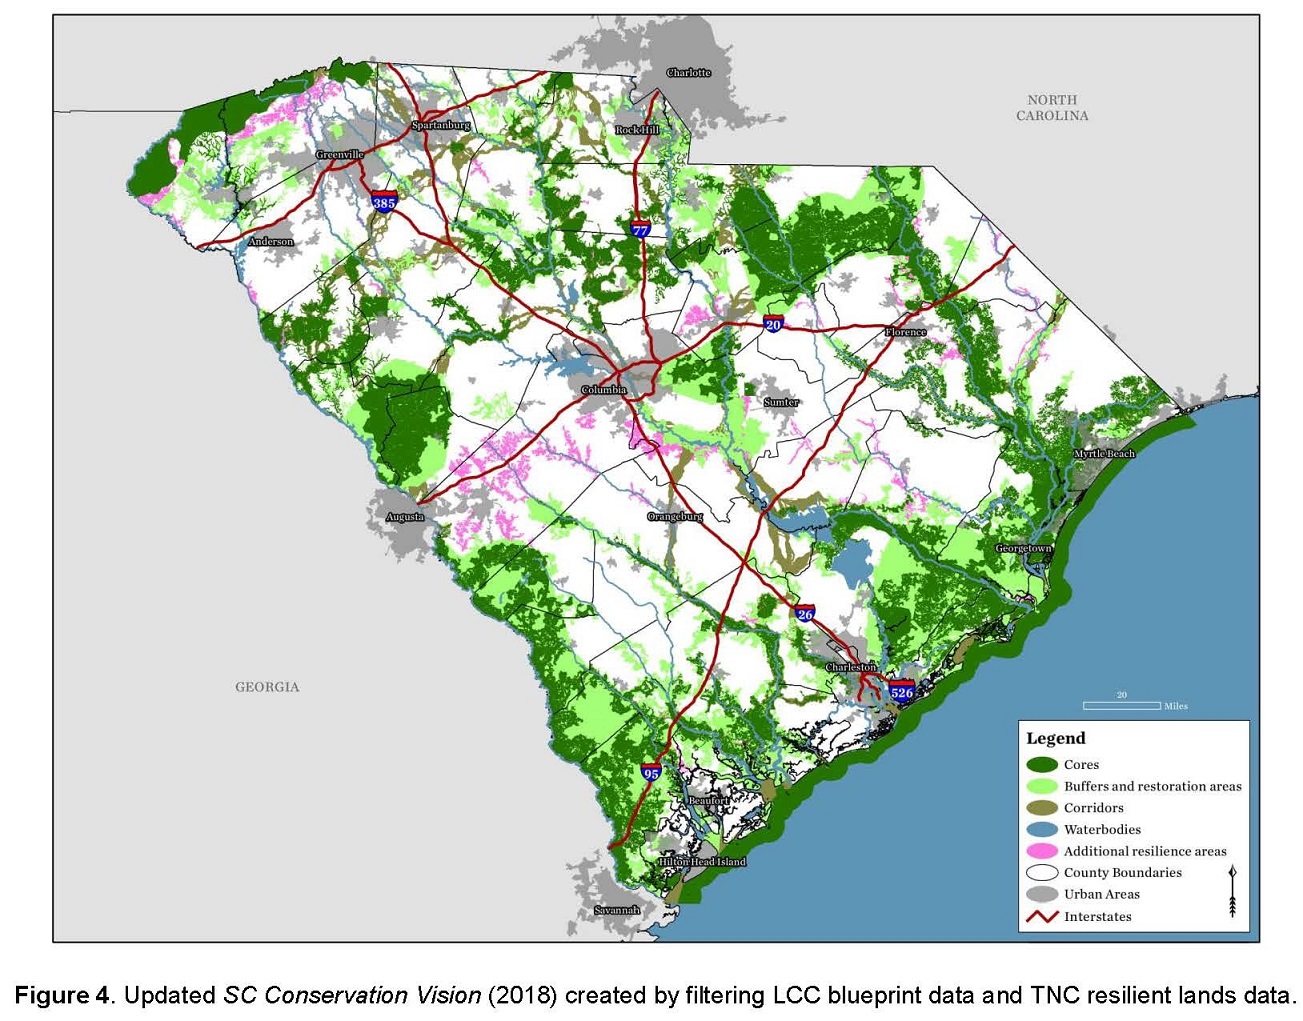
SC TNC’s final vision has now been officially released. Just like the previous version, the update includes core areas, buffers, and corridors. In addition to the Blueprint, it relies on TNC’s Resilient Lands analysis. While TNC’s Resilient Lands analysis is already an input in the Blueprint, there were a few important above-average resilient areas that didn’t come out strongly with the approach to filtering the Blueprint. It’s important to note that, like the Blueprint itself, the vision isn’t intended to replace or consolidate other plans. It simply identifies key conservation cores and corridors, and is available as a resource for all conservation partners working in SC.
If you’re interested in learning more, you can read TNC’s full report here. You can also explore an interactive story map to learn more! And you can download the Conservation Vision layers from Box if you want to play with the data.
If you’d like to know more about the methods that were used to filter down the Blueprint to identify these large patches of cores, buffers, and corridors, we talk more about that in this recording of a Third Thursday Web Forum focused on using the Blueprint to inform organizational priorities. The section about the TNC vision starts around 7:48.