Are we meeting our shared goal to improve ecosystem health, function, and connectivity across the Southeast?
The 2024 update to the Recent Trends in Southeastern Ecosystems report tracking progress toward the SECAS Goal is now available!
Background
A shared goal is an important component of any partnership. Goals help rally individuals and organizations around a clear statement of what they’re trying to accomplish together, and create a shared measurement system for evaluating success. There’s nothing like a good map or graph that shows that something is off track for meeting a goal to spark conversations about both the challenges and opportunities to get back on track! Especially with a group as broad and diverse as the conservation community, it’s helpful to see what our collective work is adding up to and what resources are at risk of falling through the cracks.
Overall, the SECAS partnership has a goal to achieve a 10% or greater improvement in the health, function and connectivity of Southeastern ecosystems by 2060. To break down the 10% target into bite-sized pieces, we need to see a 1% improvement every 4 years.
Want to know the history of how this goal was set back in 2018? Check out these blog posts:
- Identifying ambitious but achievable ecosystem goals for the Southeast
- Goal for Southeastern ecosystems approved by state wildlife agency directors
Every other year or so, SECAS releases a report evaluating progress toward the goal called Recent Trends in Southeastern Ecosystems. It uses the best available data from existing Southeast-wide monitoring programs to assess trends in ecosystem health, function, and connectivity since SECAS was established in 2011. To develop the 2024 update to the goal report, we compiled information from a few new sources and called on experts to review our methods for estimating change over time.
This year’s updates
This report is the fifth assessment of progress toward the goal! Here’s what’s new this year:
- Updated data for all bird indicators (beach birds, forested wetland birds, grassland and savanna birds, and upland forest birds). Grassland and savanna birds was previously called “pine and prairie birds”, but we updated it this year to match the new grassland and savanna area indicator. We switched from using Breeding Bird Survey data to using eBird data. They show similar overall trends, but eBird can break down trends at a much finer spatial scale.
- Another year of data for prescribed fire in longleaf pine
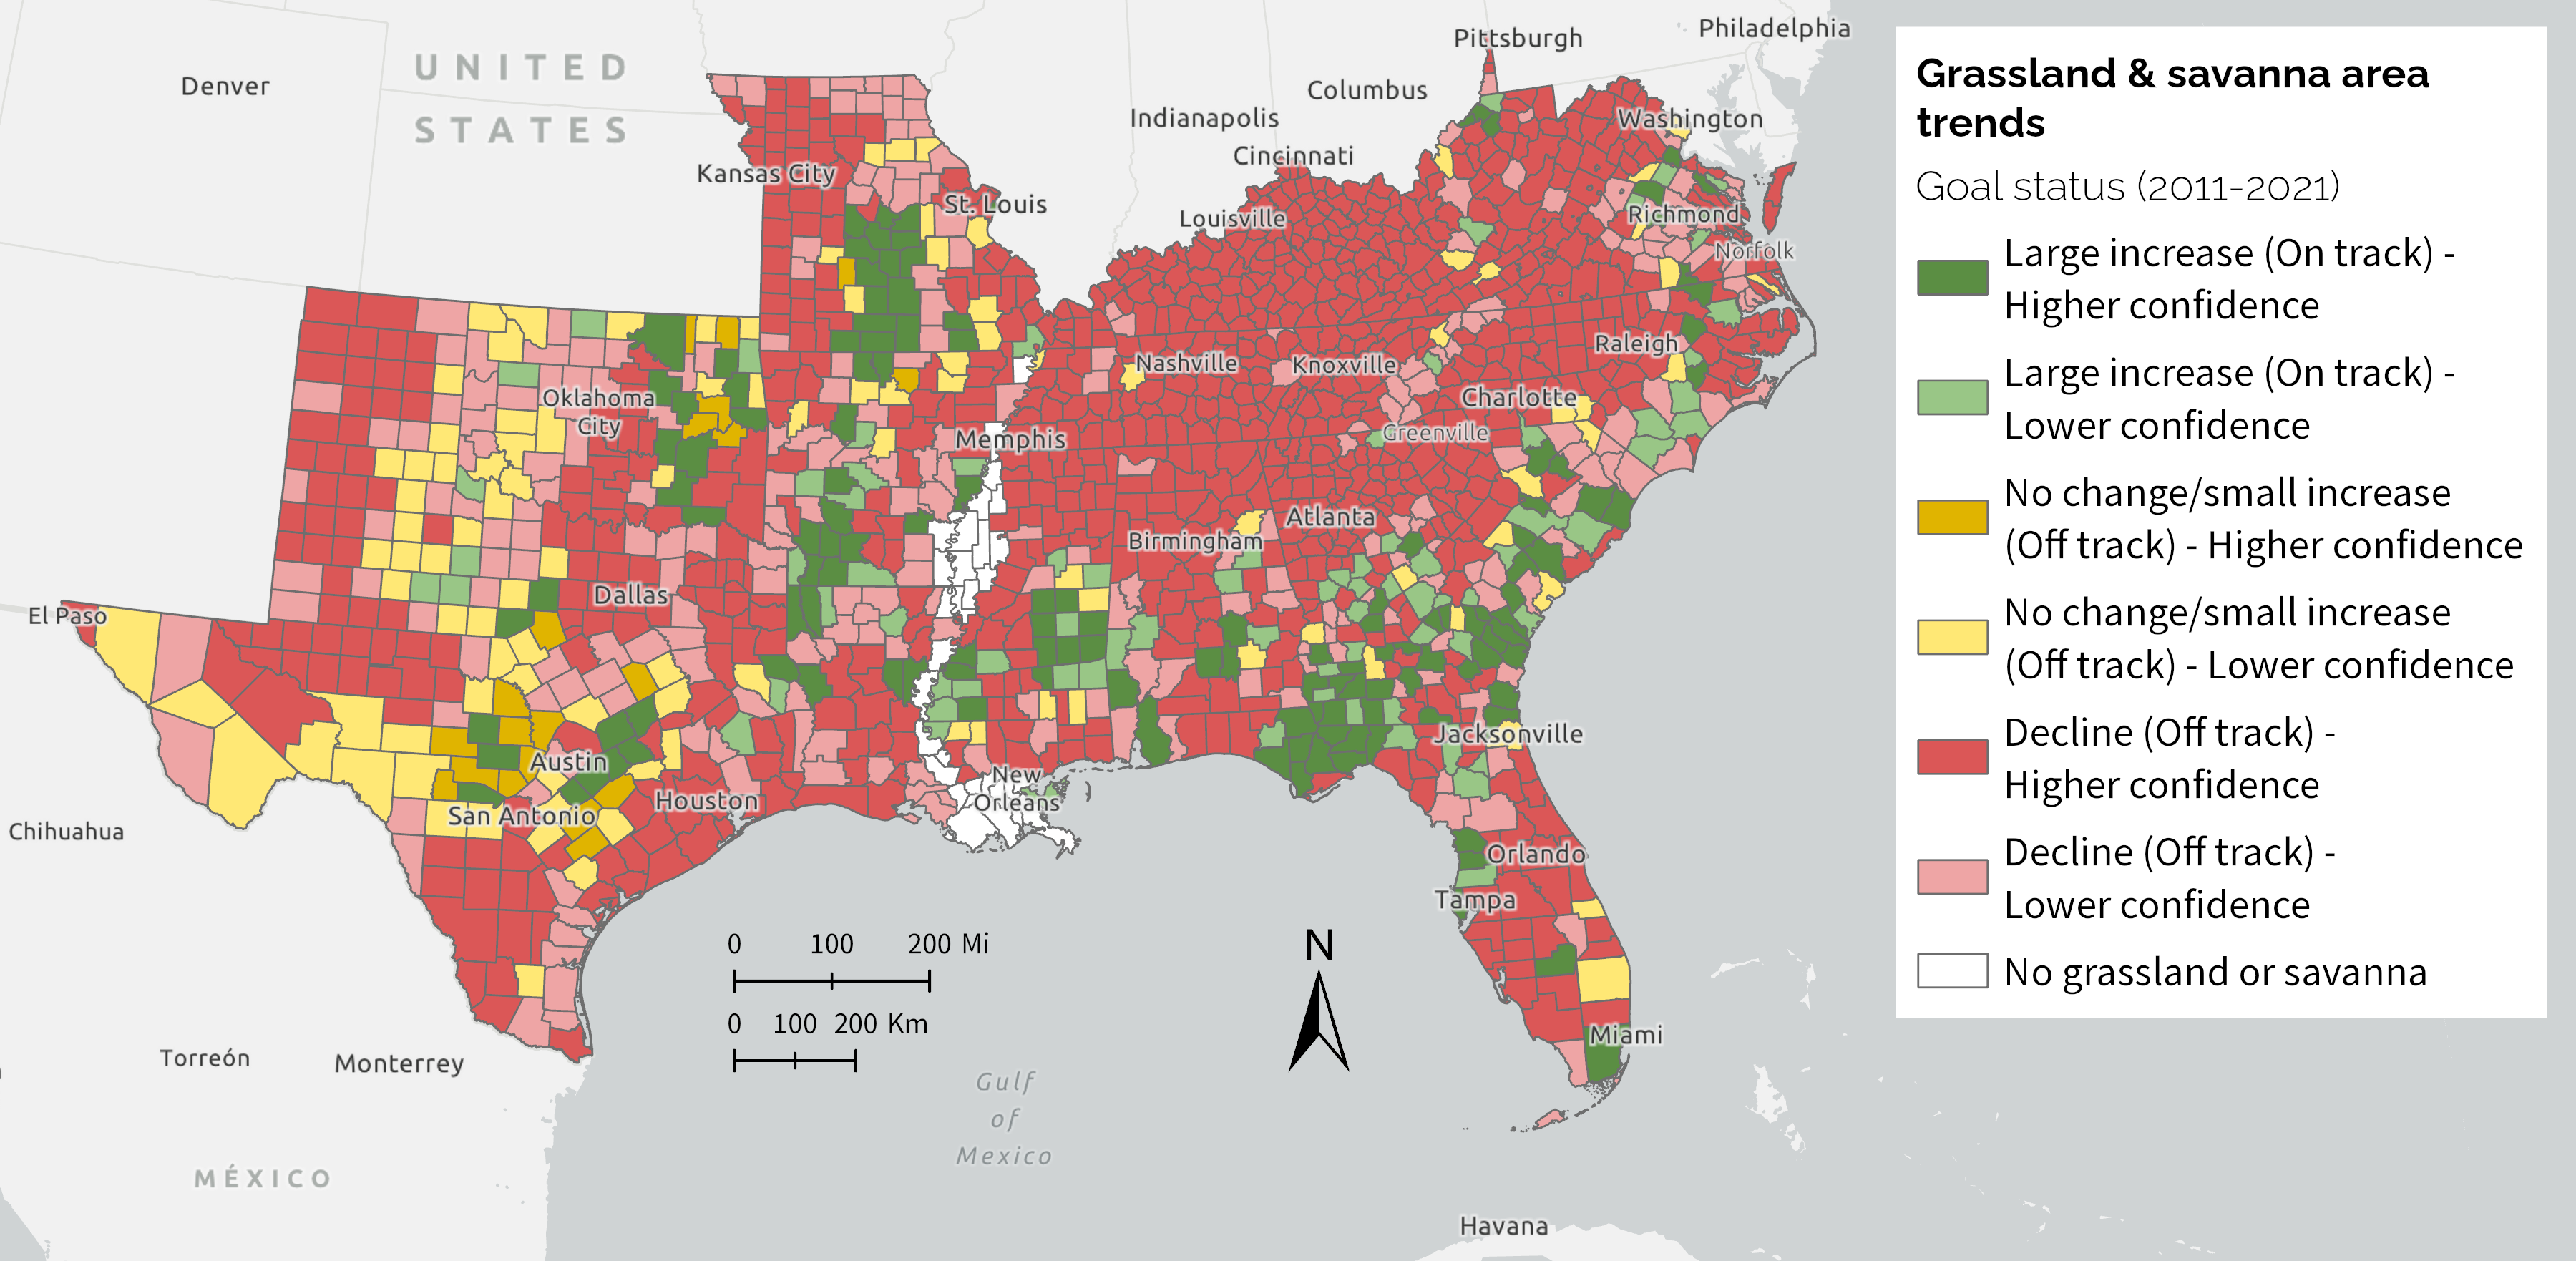
- A new indicator for grassland and savanna area, which uses a similar approach to the new indicator in the 2024 Blueprint
- Simpler, consistent confidence categories for trends (“lower” and “higher”)
Now available as a story map too!
In the past, the report has been shared as a static document, and we’re still offering that format. But this year, at the request of the SECAS Executive Steering Committee, we also transformed the report into a story map in hopes that it will be more user-friendly and generate even more discussion on achieving the goal. Now you can interact with some of the trends using spatial dashboards to see how they vary across the landscape!
-
Story map: https://storymaps.arcgis.com/stories/857b5b1fbd884d199051f42335fd5aef
-
PDF: https://secassoutheast.org/pdf/SECAS-goal-report-2024.pdf
So how are we doing?
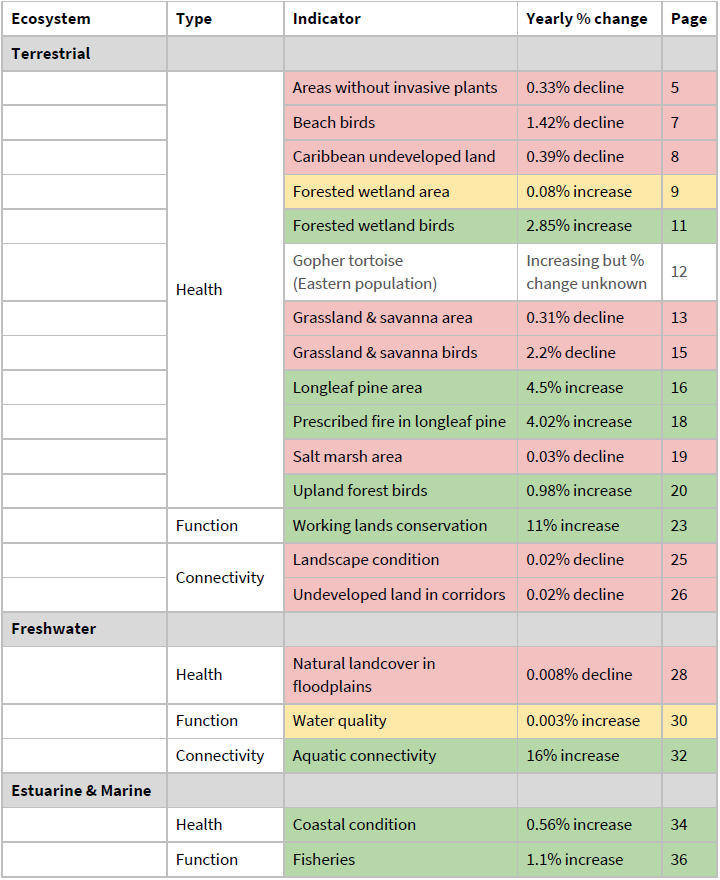
A majority of indicators improved overall during the period covered in this report. Given the rapid changes happening in the Southeast, this is an encouraging sign for achieving the SECAS goal. Longleaf pine area, prescribed fire in longleaf pine, aquatic connectivity, forested wetland birds, upland forest birds, working lands conservation, coastal condition, and marine fisheries indicators improved fast enough to stay on track to meet the SECAS goal. These have all been major areas of shared conservation focus in the Southeast, and those efforts are clearly having a big impact.
Only 9 of the 20 indicators had declining trends. Of these, grassland and savanna birds continue to be the most off track for meeting the SECAS goal. Declines in habitat quantity and quality are likely driving this pattern. There is still hope that focused conservation can have an impact, as targeted improvements in habitat quality in the longleaf pine range resulted in increases in grassland and savanna species like Bachman’s sparrow and red-cockaded woodpecker. This further reinforces the importance of accelerating open pine, pine/oak savanna, and other grassland restoration throughout the Southeast for grassland birds, pollinators, and other key species.
Questions? Comments?
Creating a shared measurement system and tracking progress at the landscape scale isn’t easy. We strive to work together to improve our shared measurement system over time. We welcome your feedback on the report and story map! Reach out to me (emily_granstaff@fws.gov) if you want to walk through it together.