FUTURES urban growth models now have map services in the SECAS Atlas

New probability of urbanization map services available
For the last 1.5 years, the Southeast Blueprint Explorer has used the new FUTURES v2 urban growth projections for the continental United States developed by NC State University’s Center for Geospatial Analytics. We use this dataset to assess the likelihood of urbanization across the Southeast for every decade from 2020 to 2100. This important work was led by Dr. Anna Petrasova and Dr. Georgina Sanchez, and funded by the Southeast Climate Adaptation Science Center (CASC). The CASC’s blog about the data release is a great resource. Having this land use change layer available in our viewers and automated reporting helps Blueprint users understand how the places where they live, work, and play are predicted to be impacted by urban growth.
While the raw data has been available on ScienceBase since the official data release in June 2023, I’m happy to announce that the project team recently made web map services that are now available in the SECAS Atlas! Eagle-eyed users of the Atlas may have already noticed those layers sneak into the threats section of the Blueprint page a few months ago. These map services categorize the more continuous urban growth probabilities into easy-to-interpret bins that align with the way we’ve summarized the data in the Blueprint Explorer for the last several years.
How does FUTURES work?
So how does FUTURES work, and what can it tell us? Well, first of all, even though I’m certainly guilty of using “FUTURES” as a shorthand for this particular data product (even throughout this blog), that isn’t completely accurate. FUTURES is an abbreviation for a particular model, an algorithm—just like Zonation or Maxent or Random Forest. It stands for FUTure Urban-Regional Environment Simulation (cute, right?). One of the unique things about it is “it is one of the few land change models that explicitly captures the spatial structure of development in response to user-specified scenarios.” The specific output of FUTURES that we use in the Explorer, and include in our Atlas, uses version 2.0 of the software under a status quo urban growth scenario—basically business as usual. It asks for the entire continental United States, “what might the future look like if current trends and growth patterns continue?”
The model simulates landscape change based on trends in population growth, local development suitability factors, and an urban patch-growing algorithm. It considers environmental drivers like distance to floodplain, slope, and available infrastructure, and even socio-economic status. “Present day” conditions are represented by the developed classes of the 2019 National Land Cover Dataset. To create the probability of urban growth layer that SECAS ultimately uses, the project team performed 50 stochastic—or random—model runs. In other words, they ran the model 50 separate times for each decade, generating 50 potential “futures” (hah, get it?).
The probability for each area—each 30 m pixel in the resulting raster dataset—reflects how many times it urbanized out of those 50 model runs. If it urbanized just once, that’s a 2% chance of urbanization (1/50 = 0.02). If it urbanized 25 times, that’s a 50% chance (25/50 = …you get it). Of course, you can use the stochastic model outputs individually, and in fact, the project team often recommends that to serve as a more concrete snapshot of what the future might look like. SECAS uses the probability output to synthesize all those possible scenarios into one single layer, and particularly, for consistency with what our users were accustomed to seeing from the previous SLEUTH urban growth probabilities that we served up in our viewers.
How is FUTURES different from SLEUTH?
At the simplest level, SLEUTH is just a different urban growth model. If you aren’t already familiar with it, you don’t need to worry about it—but for those who used it in the past, I thought it might be helpful to explain the differences as I understand them.
A project that ran the SLEUTH model for the entire Southeast United States got a lot of press for predicting the rise of a megalopolis connecting Charlotte, NC to Atlanta, GA (“Charlanta”). This work was also funded by the Southeast CASC, led by Dr. Adam Terando and colleagues. The data was released in 2014, and for a decade, it offered what SECAS considered the best available urban growth projections for the Southeast! The model used patterns of road network growth from 2000-2009 to predict what future urbanization would look like if those trends continued. In a nutshell, we switched to using FUTURES because the data is more recent, and the approach is more novel.
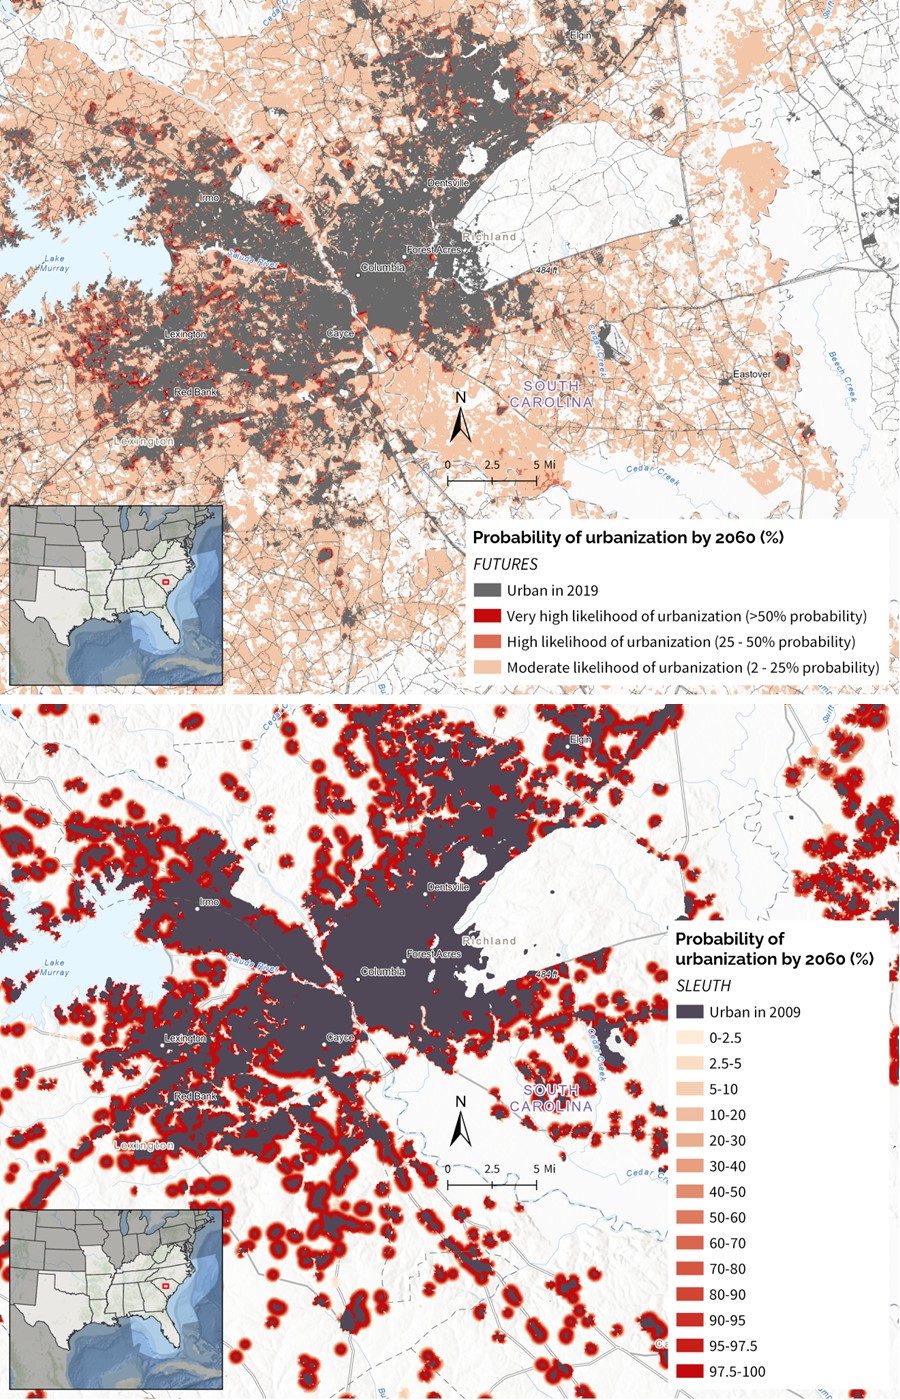
I don’t want to get too far into the weeds of how the two models work, but it’s interesting to look at differences in what the outputs look like from the perspective of an end user. To me, SLEUTH more characterized the pressure of urban sprawl for a general area, and FUTURES more characterizes the odds that any one specific place will urbanize. Let me explain what I mean.
The SLEUTH results showed, if you’ll excuse some highly technical language, big red donuts of sprawl around existing urban areas. I think of them as rings of development pressure radiating out of current (as of 2009) urban centers. Probabilities in these donuts tended to be super high in the middle, closest to the existing urban core, and then taper off as you moved further to the fringes. So, because of the large amount of high probability areas covered by these donuts, when we calculated how much of a particular area was likely to be urban by 2060 or 2100, those numbers were also really high! Now, this didn’t necessarily mean that every single pixel in that donut is literally going to become urban—urban areas don’t typically grow in such a consistent way, with concrete spreading outward like lava from a volcanic eruption. I think of it more as saying “heads-up—urban growth pressure here is really high”.
FUTURES, on the other hand, because of its more randomized patch-growing algorithm, does what I would consider to be a more realistic job of visually representing how urban areas actually grow. There’s an inherent randomness to urbanization patterns, often based on the construction of infrastructure like roads or utilities. For example, a new housing development might pop up and “seed” the growth of a suburb in ways that we couldn’t necessarily predict today! The individual outputs of each FUTURES run reflect this. Each one is a potential snapshot of what 2060 or 2100 might really look like. When you combine all these runs into a probability layer, the probabilities are generally much lower than what you saw with SLEUTH, because it’s accounting for more of that randomness and considering all suitable land (not just areas around existing urban zones).
At first, when I saw the FUTURES results, because I was used to seeing really high probabilities from SLEUTH, I found the differences jarring. But the more I thought about it, the more it made sense. If FUTURES is taking more of a site-specific, pixel-by-pixel approach, the probability that any one given pixel will urbanize would naturally be lower. After all, maybe that specific pixel won’t urbanize—maybe it’ll be the one next to it instead, or the one down the block! But if one of those FUTURES runs saw the possibility of urbanization in a particular area, we can conclude that some degree of urbanization pressure is present.
Binning the FUTURES probabilities into categories helped me significantly with the interpretation and the transition from SLEUTH. It’s hard to wrap your head around the difference between a 2% vs. a 4% likelihood of urbanization, or why an area with a lot of development pressure has a seemingly low probability. We considered anything with a 2%-25% chance in the FUTURES results to have a “moderate” probability, because at least one of the runs did predict that pixel would urbanize. Anything from a 25%-50% chance we considered “high”. And anything >50% chance we considered “very high”. These are the categories you’ll see reflected in the map services.
Of course, all the raw data is still available on ScienceBase, and it’s totally possible to crunch the numbers yourself, but having those map services already premade should save folks some time and energy. Are you interested in digging more into FUTURES? Dr. Anna Petrasova, the lead developer for this project, did a great webinar on the Third Thursday series back in July 2023. You can check out the recording here.
What about the U.S. Caribbean?
“Hang on—what about Puerto Rico and U.S. Virgin Islands? Aren’t you working on filling data gaps in the U.S. Caribbean?” I can hear you hollering through my computer screen—and rightly so. The amazing team of investigators is expanding their work to the U.S. Caribbean through additional funding from, you guessed it, our friends at the Southeast CASC. SECAS was a strong advocate for this. Predicting urban growth in the U.S. Caribbean can be really tricky, because this is a unique area that is experiencing urban growth increases despite population declines. There, the main driver of development isn’t permanent residents, but tourism, which is harder to map and model.
This next phase of the project will be focused on understanding and modeling the unique drivers of urban growth in Puerto Rico and the U.S. Virgin Islands, working closely with collaborators based there, in part through the Caribbean Conservation Community of Practice. We look forward to partnering in these efforts and pulling in the data, when it’s ready, to better serve Blueprint users there.