Balancing priorities across subregions in Blueprint 2024
A new version of Zonation software offers new opportunities
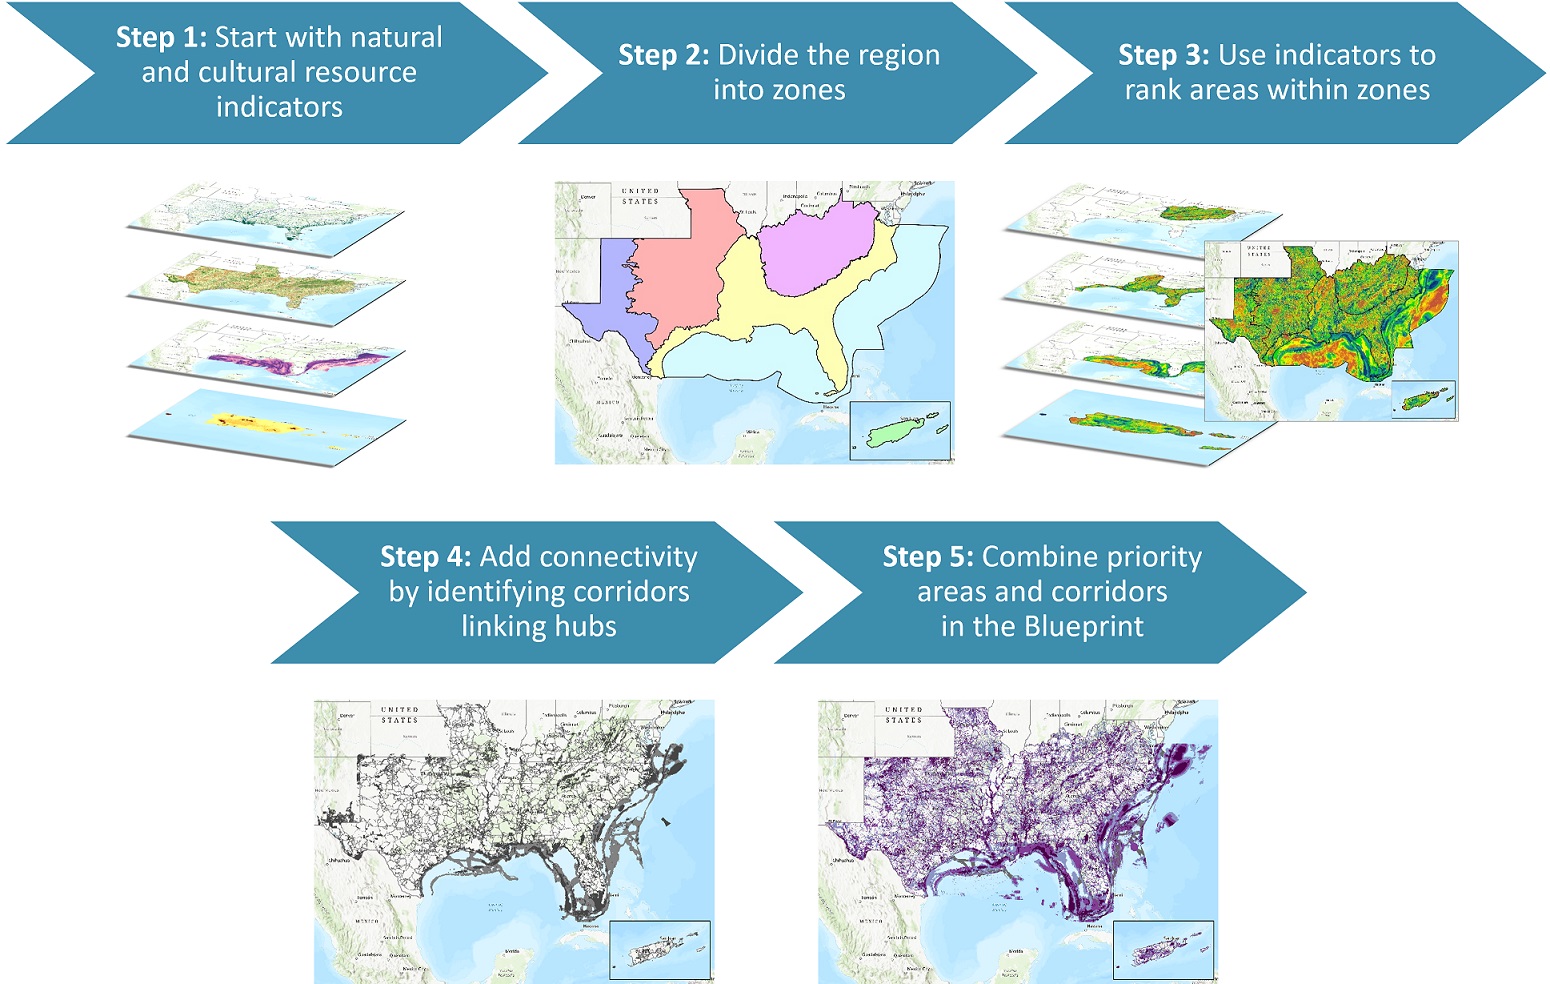
Progress on the next update to the Southeast Conservation Blueprint, version 2024, is well underway. In addition to a suite of indicator improvements, as Rua previewed in his blog back in March, Blueprint 2024 will use slightly different prioritization methods. A new version of the software used to create the Blueprint—Zonation 5—recently became available. We’ve been phasing it in gradually. Last year, we used it in the offshore marine and U.S. Caribbean. This year, we’re using it in the inland continental Southeast as well, where the change will have a bigger impact.
While it maintains the same core functionality of identifying priority areas based on their importance for a collective suite of indicators, Zonation 5 offers new modeling options over the previous version 4. In the past, computational requirements limited SECAS staff to running the software within smaller subregions and stitching together the results. When we tried to run it over larger areas, it crashed or took a prohibitively long time! That means the Blueprint priorities have so far been relative to each subregion, with the Blueprint prioritizing the most important 50% of the Atlantic Coastal Plain, 50% of the Mississippi Alluvial Valley, 50% of the Chihuahuan Deserts, etc. That’s 50% by area, so if a subregion were hypothetically 10,000 acres in size, 5,000 acres would become a priority in the Blueprint.
The new version of Zonation uses a much more efficient ranking algorithm, reducing processing time from weeks to days. As a result, staff can use it to prioritize larger areas of the Southeast. To take advantage of this, we aggregated the subregions with somewhat similar ecosystems into “zones,” allowing Zonation to look across bigger areas to compare multiple subregions at once. This presents new opportunities and tradeoffs, giving us a chance to step back and reevaluate our objectives. What is the right balance of priorities across different subregions within the SECAS geography? To what extent should exceptional subregions with particularly high indicator scores be allowed to shine in the overall plan vs. ensuring each subregion gets its fair share of the priorities?
Keep in mind that year’s Blueprint update will continue to prioritize 50% of the total SECAS geography; Zonation 5 just provides a more flexibility on how those priorities are distributed across the region. This may appeal to Blueprint users who work at regional scales and want to use the plan to compare across broad areas.
This year, the new version of Zonation can look across larger areas to compare multiple subregions. SECAS staff grouped the previous subregions into zones that define the boundaries of each Zonation run. The colored polygons represent the subregions; the darker black lines around similar colors of subregions represent the zones.
Gathering input from focus groups to refine the new approach
To help us wrestle with these tough questions, SECAS staff held a series of focus groups earlier this spring. With so much nuance and technical complexity to cover, we wanted to keep the discussion focused, so we capped the size of each focus group to 10 people. We invited the SECAS Points of Contact and a handful of Blueprint users representing different sectors, geographies, and scales of decision-making.
During the focus groups, Rua presented an overview of the past methods and a handful of potential alternatives. Attendees compared maps of a few different options—some where the amount of priority varied significantly between subregions, and some where we kept things more balanced—considering both the underlying rationale and the spatial results. After discussing the pros and cons, they voted on their preference. As always, folks brought unique ideas, experiences, and insights to the conversation! Staff did our best to combine what we heard from the open dialogue and the final voting to chart a course for the 2024 Blueprint.
In summary, here’s what staff took away from the focus groups:
- There was no support for an “every subregion for itself” approach where we don’t attempt to balance across subregions at all. While it might make sense in theory to let the indicators alone drive the priorities, folks felt that the current indicators weren’t sufficient to create a representative network. This method created dramatic disparities—“haves” and “have nots”—where some subregions were 95% prioritized, and others only 15%.
- At the other extreme, a few folks wanted to mimic the previous Zonation approach by prioritizing 50% of every subregion, where each gets an equal share of the Blueprint. This would be helpful for those who work in a few different subregions and want the Blueprint to highlight the best parts of each one.
- Most popular by far was a hybrid option where we let the indicators drive the priorities, but also add each subregion as an input to Zonation to better spread the priorities around. This compromise finds a nice middle ground, letting the indicators largely run the show while ensuring no subregion gets left behind. Since the hybrid approach still created significant variation in the share of priorities that each subregion received (~40%-90%), a handful of folks also supported adding a minimum or maximum amount of priority—a floor or a ceiling—to smooth things out. Setting a minimum in the 20-40% range emerged as a popular recommendation, which we could accomplish by adjusting the weights of the subregional inputs.
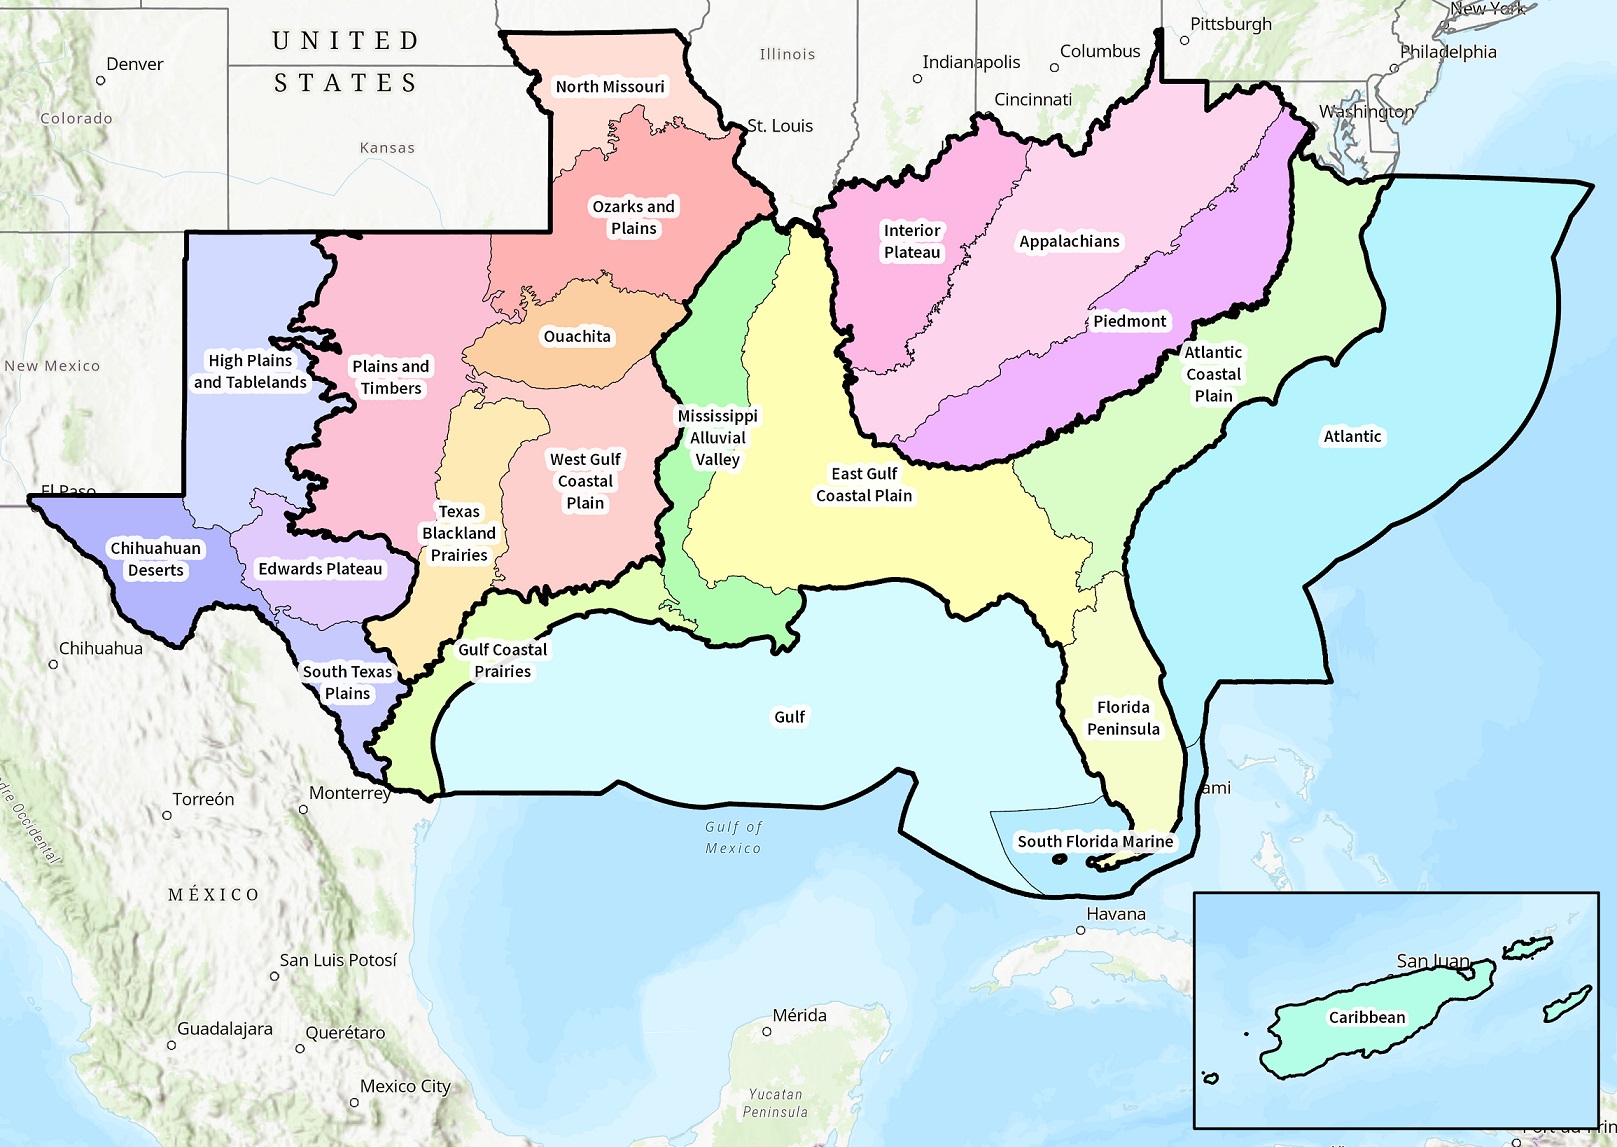
- A Blueprint user with hands-on experience in Southwest Texas suggested subdividing the zone in the western part of the SECAS geography to separate the more arid, desert subregions from their wetter counterparts. When staff tested this suggestion after focus groups, using this climate gradient to better define the zone boundaries significantly improved the balance of priorities.
The plan for Blueprint 2024
So that’s what we heard—where did we end up?
- We created a new “arid West” zone to split out the desert subregions in the western SECAS geography. Ensuring these drier subregions compete only with each other dramatically reduced over-prioritization in this area. The map above reflects this added zone.
- Following the overwhelming preference from focus groups, we used the subregions as inputs to Zonation to better stratify priorities across each zone, and by extension, the broader region.
- Since most people preferred not setting a maximum or a minimum, and adjusting the weights to accomplish this would add time and complexity to the modeling process, we pursued indicator-level weighting solutions to mitigate instances of under- and over-prioritization. This improved the balance across subregions enough to avoid the need for further guard rails!
The result? At this stage of the process, before adding corridors, 40-60% of each subregion is prioritized in the 2024 Blueprint. We hope this honors the range of focus group feedback, and as always, we’d love to hear from you about how well this approach is working. You can always reach out to a member of SECAS staff to share your thoughts, or you can weigh in during Blueprint workshops later this fall. More information to come on workshops in next month’s newsletter!