From the archive - The state of Southeastern ecosystems

How are the ecosystems of the Southeast doing? How is that changing over time? I’ve been working on integrating ecosystem assessments across the Southeast to get at those key questions, primarily to support a major task this year for the Southeast Conservation Adaptation Strategy (SECAS): developing an explicit and near-term goal.
The big idea is trying to use existing assessments to create a yearly assessment of ecosystem condition and trends. Some of these existing assessments are yearly, while others are every five years, but every year there’s some new information about how ecosystems are doing. So far, I’ve been integrating a range of assessments using broad ecosystem types and a 0 – 100 condition score based on the data-driven scores in each assessment. While this is still a work in progress and there are many ways to slice up these data, it seemed like a good time to share with you some of what I’ve found so far.
Assessments used
Subregional:
- Chesapeake Bay Report Card
- State of the South Atlantic
- Everglades Report Card
- Tennessee River Basin Report Card
- Mississippi River Watershed Report Card
National/Regional:
- National Rivers and Streams Assessment
- National Coastal Condition Report
- Through a Fish’s Eye: The Status of Fish Habitats in the United States
- The Future of America’s Forests and Rangelands
- State of the Birds
- State of the Beach Report Card
- Status of U.S. Fisheries
Current condition
Here are the scores on a scale from 0 – 100, representing the current condition of ecosystem health, function, and connectivity. These are based on an area-weighted average across multiple assessments. As you can see, marine and estuarine score the highest while pine and prairie get the lowest score.
| Marine | 64.8 |
| Estuarine | 63.8 |
| Freshwater aquatic | 58.6 |
| Forested wetlands | 49.4 |
| Upland forest | 46.3 |
| Beach and dune | 47 |
| Freshwater marsh | 46.1 |
| Pine and prairie | 37 |
Trends
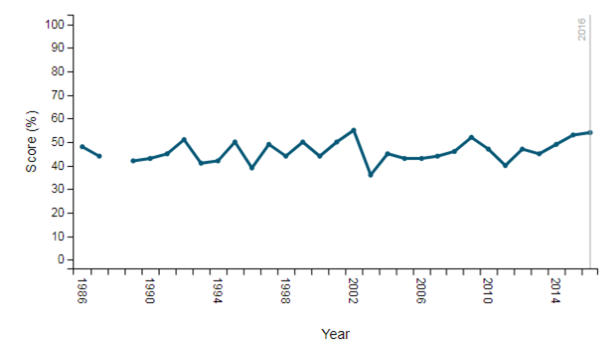
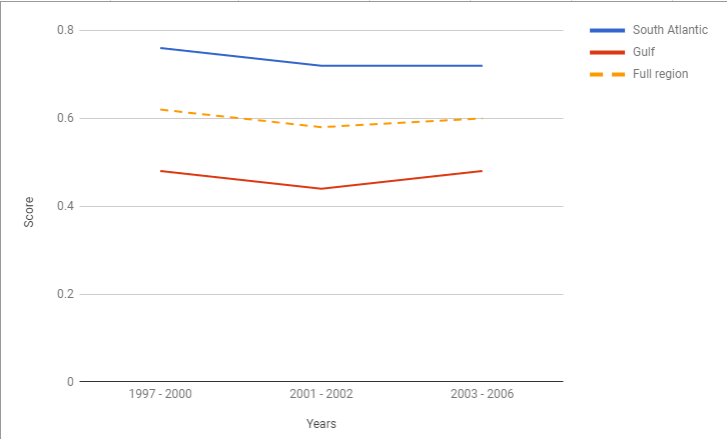
Aquatic assessments are relatively stable or increasing. Below are examples from the Chesapeake Bay Report Card and the National Coastal Condition Assessment.
Pine and prairie species are doing much worse than those in upland forests and forested wetlands. The example below shows national bird population trends by ecosystem.
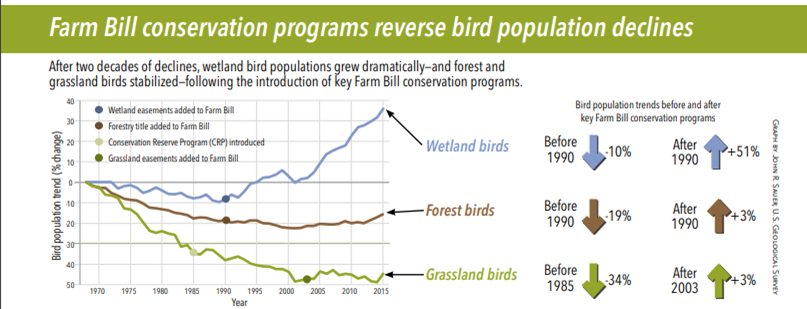
The chart above summarizes the data nationally. Does this same pattern hold up in the Southeast? To find out, I looked at Breeding Bird Survey trends in the Southeast from 2005 – 2015. I selected 10 species that were most broadly shared across State Wildlife Action Plans in the Southeast: five dependent on pine and prairie and five dependent on upland forest and/or forested wetlands. Here’s what I found:
- All five pine and prairie species were declining (Northern bobwhite, Bachman’s sparrow, grasshopper sparrow, loggerhead shrike, field sparrow)
- All five upland forest or forested wetland species were stable or increasing (Wood thrush, prothonotary warbler, Louisiana waterthrush, red-headed woodpecker, worm-eating warbler)
Next steps
This was all a quick prototype of what a yearly report on the ecosystems of the Southeast might look like, primarily to support the explicit goal setting for SECAS. Next month, I’ll try to blog about what ecosystem conditions might be possible in the future and how this all connects to the Southeast Conservation Blueprint.